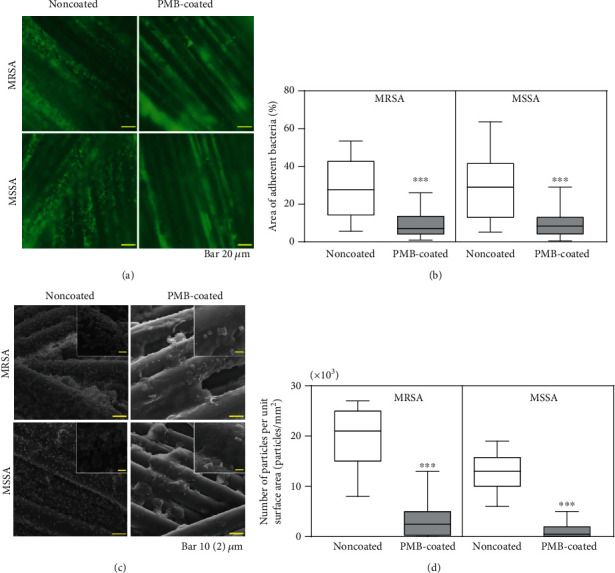
Figure 4.

Evaluation of biofilm formation. (a) Representative fluorescence microscopy images of sutures after bacterial culture for 24 h in vitro. The scale bar indicates 20 μm. (b) Box-and-whisker plots of the area of adherent bacteria on sutures after bacterial culture for 24 h in vitro. ∗∗∗p < 0.001. (c) Representative SEM images of bacterial adherence after bacterial culture for 24 h in vitro. The scale bar indicates 10 μm. Insets are magnified images (scale bar indicates 2 μm). (d) Box-and-whisker plots of adherent bacteria on suture surfaces after bacterial culture for 24 h in vitro. ∗∗∗p < 0.001.
