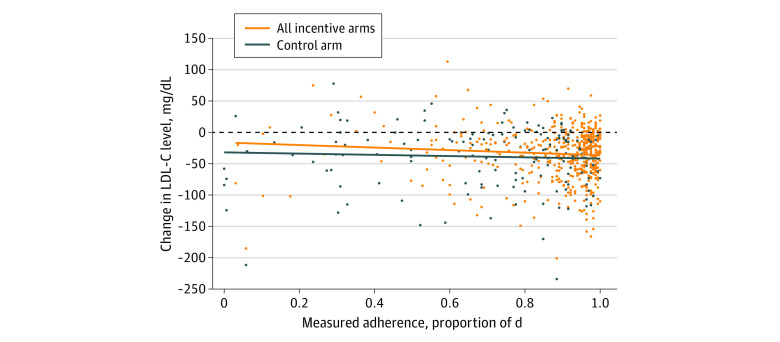
Figure 3. Change in Low-Density Lipoprotein Cholesterol (LDL-C) Levels for the Control and Combined Incentive Groups.
Change in LDL-C is shown as a function of measured adherence (proportion of days with electronic pill bottle openings) over the 6-month intervention period. The dots show observed data, and the lines indicate predicted values with 95% CIs for separate linear regressions of change in LDL-C on measured adherence alone. To convert LDL-C to mmol/L, multiply by 0.0259.

