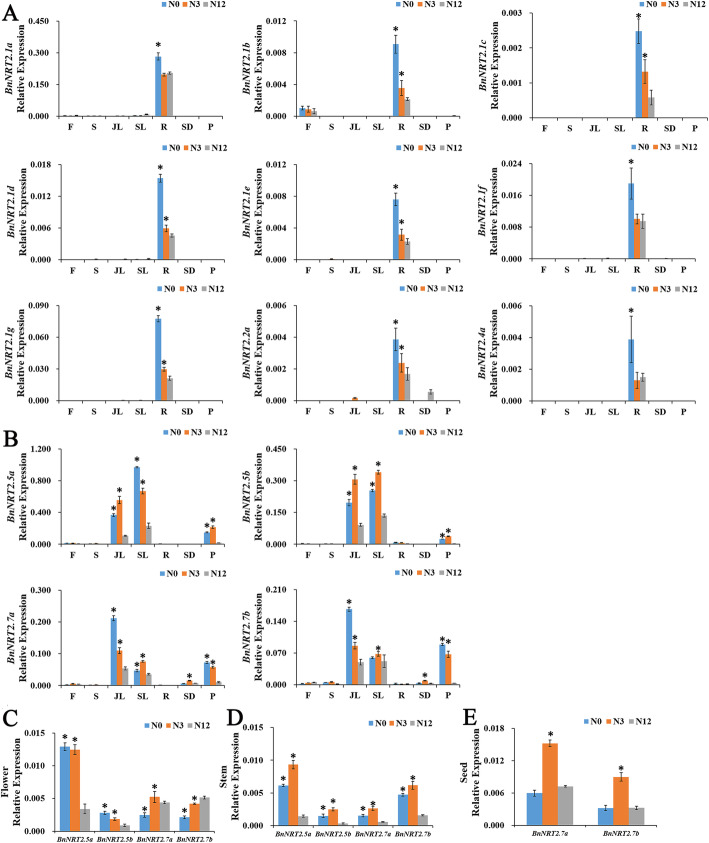
Fig. 5.
Responses of BnNRT2 expression profiles to alterations in N supply as determined in qRT-PCR assays. a Responses of root specific BnNRT2 genes (BnNRT2.1 s, BnNRT2.2a and BnNRT2.4a). b Responses of shoot specific BnNRT2 genes (BnNRT2.5 s and BnNRT2.7 s). c Responses of BnNRT2.5 s and BnNRT2.7 s in flower. d Responses of BnNRT2.5 s and BnNRT2.7 s in stem. e Responses of BnNRT2.7 s in seed. For these assays, rapeseed was cultivated in the field plots supplied with 180, 45 or 0 kg/hm2 N. The rapeseed plants grown in 180 kg/hm2 N-supplied plots were regarded as the control plots at each sampling time. Asterisks mark significant differences in expression between control plots and plots supplied 45 or 0 kg/hm2 of urea (P < 0.05)

