
Fig. 1.
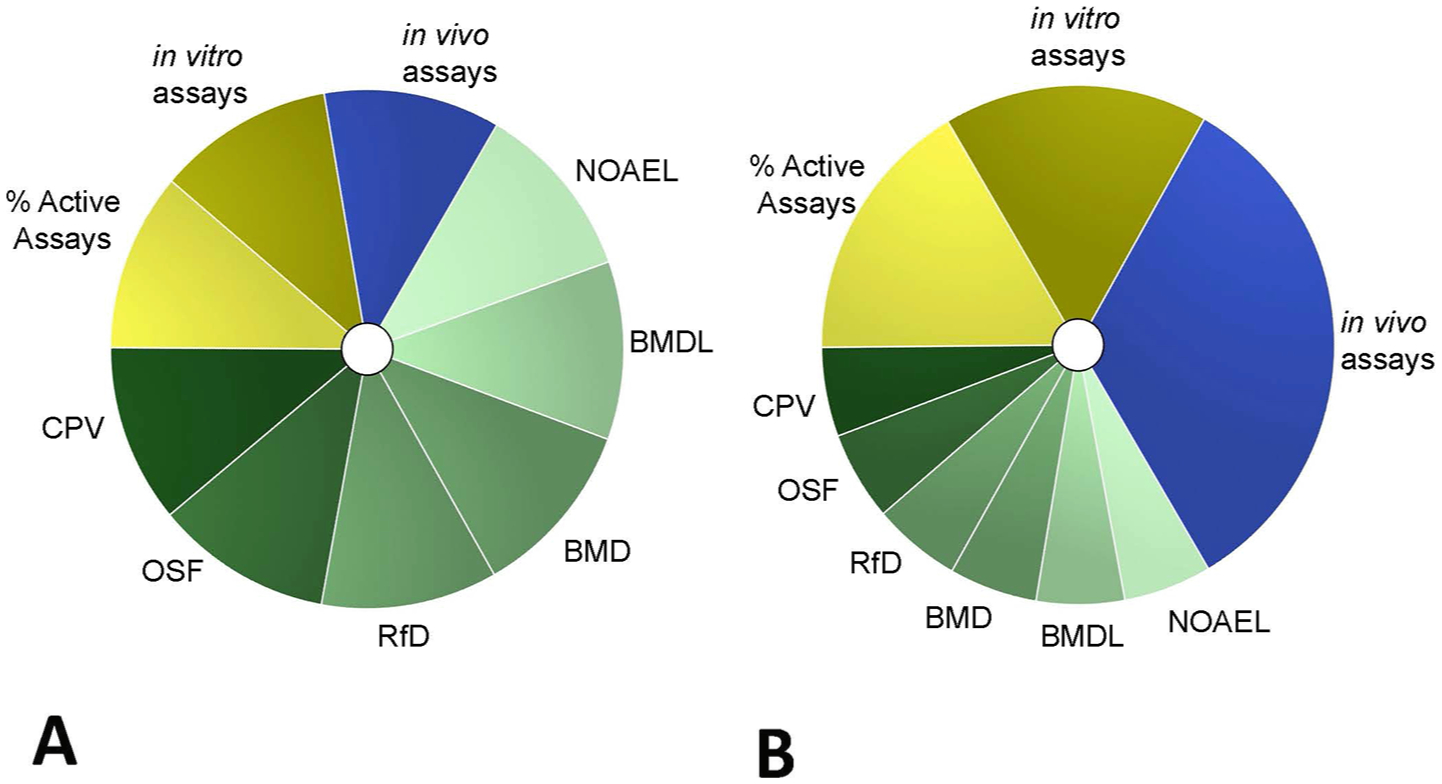
ToxPi definitions and notations. A: original analysis where equal weighting was given for each endpoint; B: alternative weighting, where each domain was given equal weight. Each chemical was analyzed using unweighted (A) and weighted (B) combinations of data from multiple domains, which are represented by slices of a similar color: in vivo ecotoxicology endpoints (blue), in vitro high throughput screening assays (yellow), and known or conditional human health toxicity values (green). Individual slices represent data from related assays, endpoints, or analyses. The distance of each slice from the center indicates the normalized value of the component. The angle of the slice represents how that component is weighted relative to the other components in the overall ToxPi calculation. Cancer potency value (CPV), Oral slope factor (OSF), Reference dose (RfD), Rfd Benchmark dose (BMD), RfD Benchmark dose lower limit (BMDL), RfD No observed adverse effect level (NOAEL).