
Fig. 5.
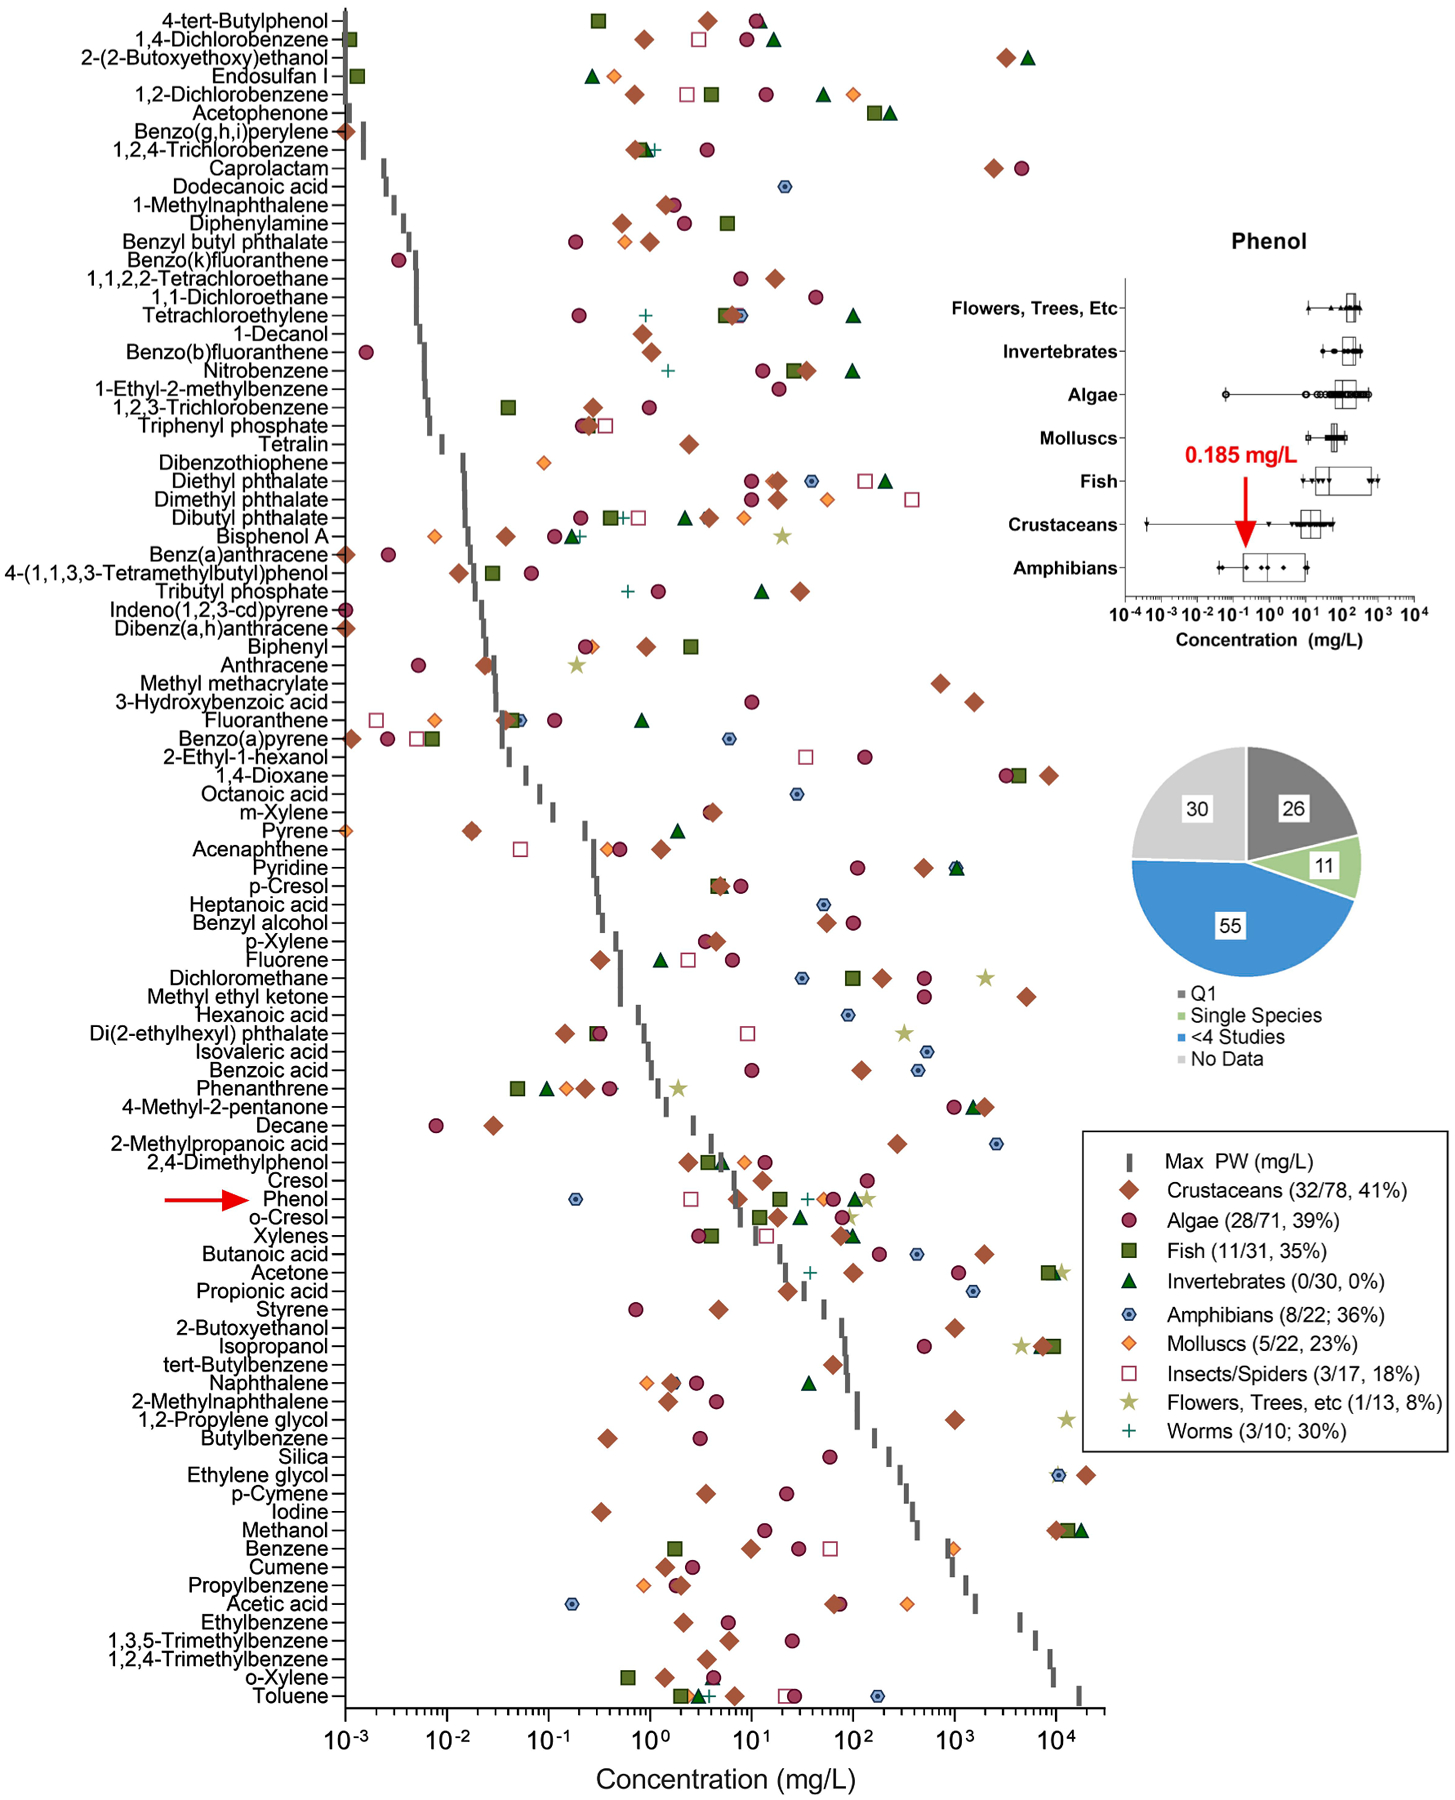
Characteristic concentrations for EC50 (lower quartile or minimum concentration) for aquatic organisms by species group, compared to maximum concentration measured in produced water (mg/L). Inset displays an example box and whisker plot of EC50 that was used to determine quartiles across all effects by phenol on each species group. The lower quartile concentration for the most sensitive species group was chosen for each chemical (i.e. amphibians for phenol) as the characteristic concentration for ToxPi analysis. The pie chart indicates the available data for the chemicals included in this analysis.