
Fig. 6.
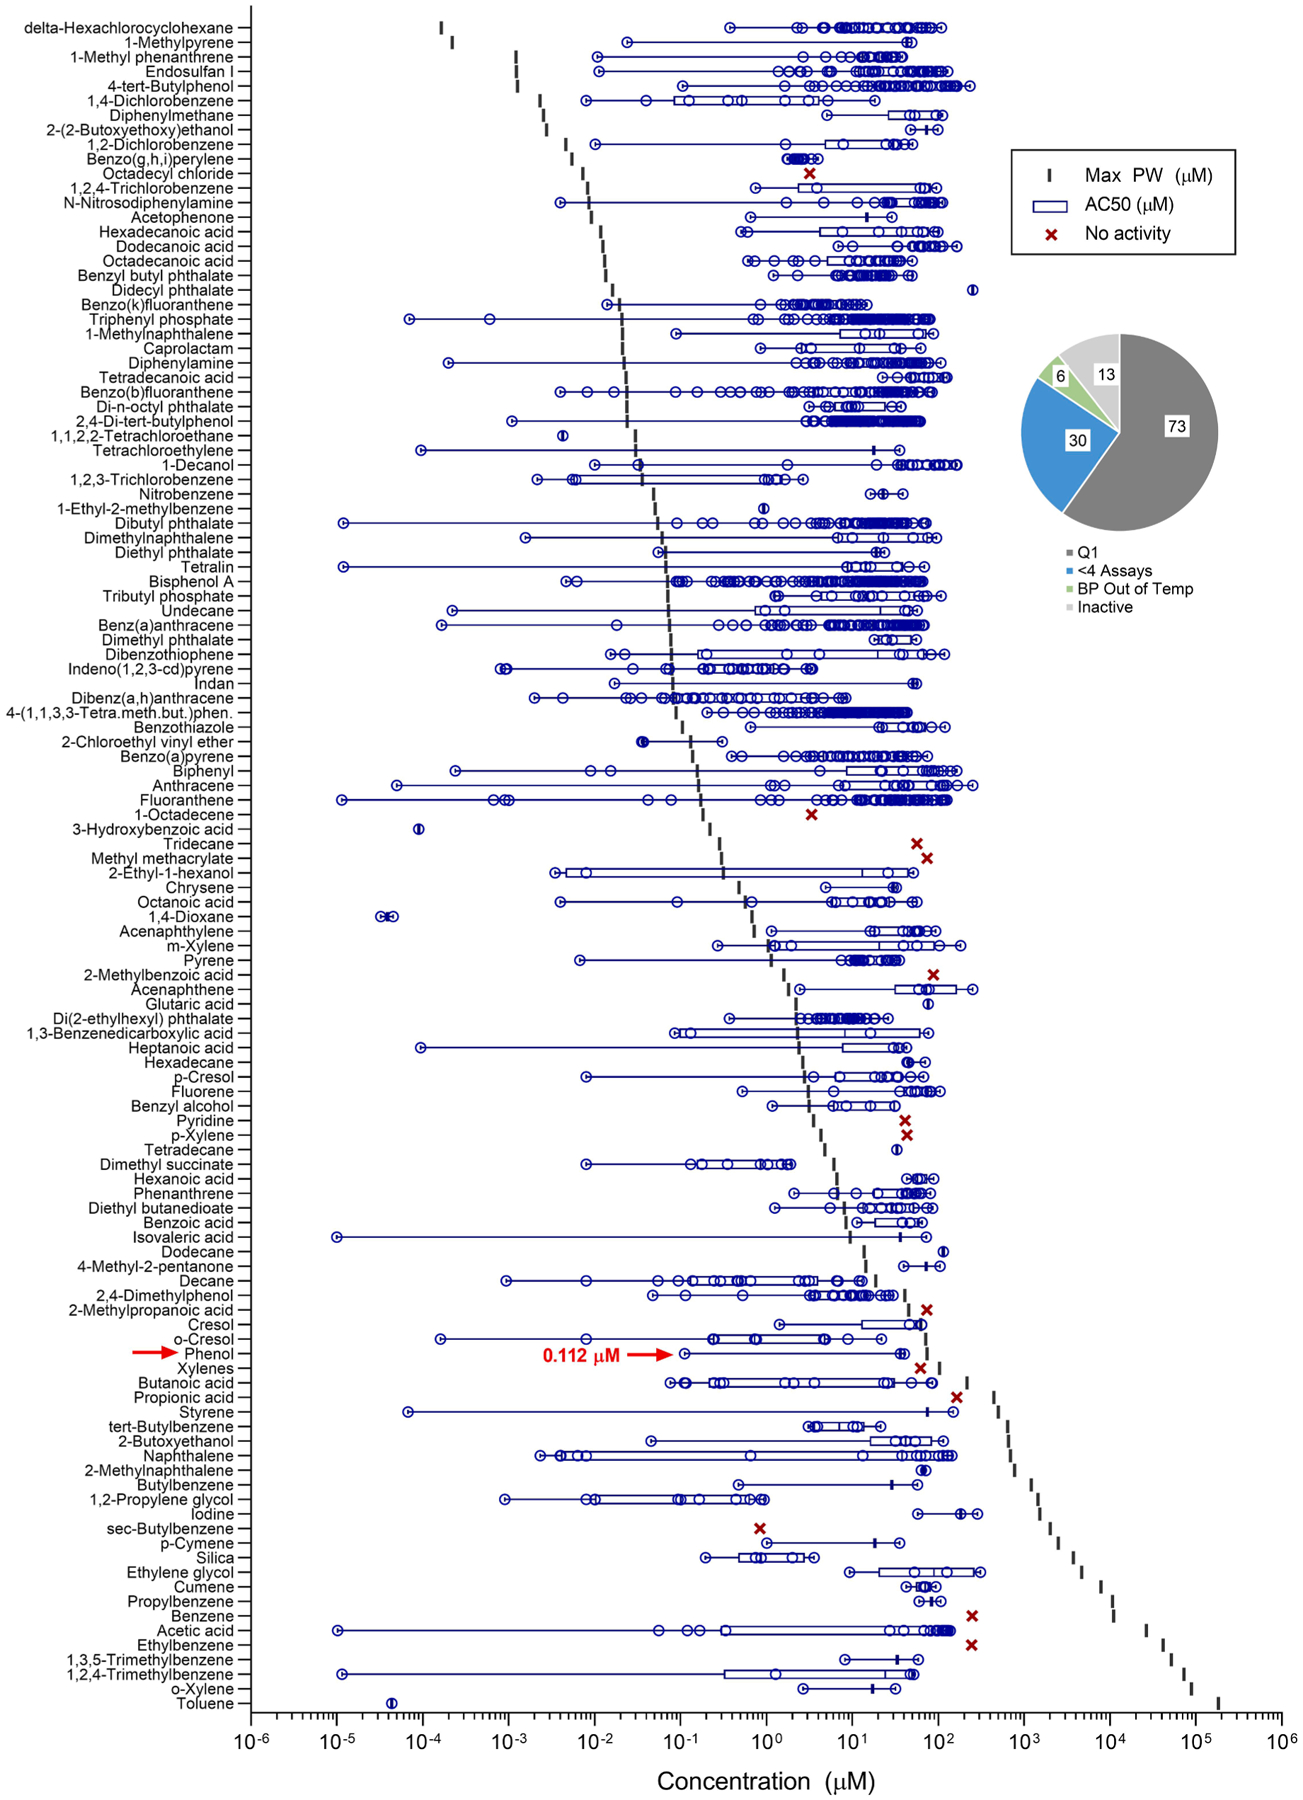
Characteristic concentrations for AC50 (lower quartile or minimum concentration) for ToxPi analysis, compared to maximum concentration measured in produced water (μM). For in vitro assays, the characteristic effective concentration was calculated as the Q1 of AC50 across all active assays, if greater than four assays. Else, the minimum value was chosen. An example compound (phenol) is called out. The pie chart indicates the available data for the chemicals included in this analysis.