
Fig. 7.
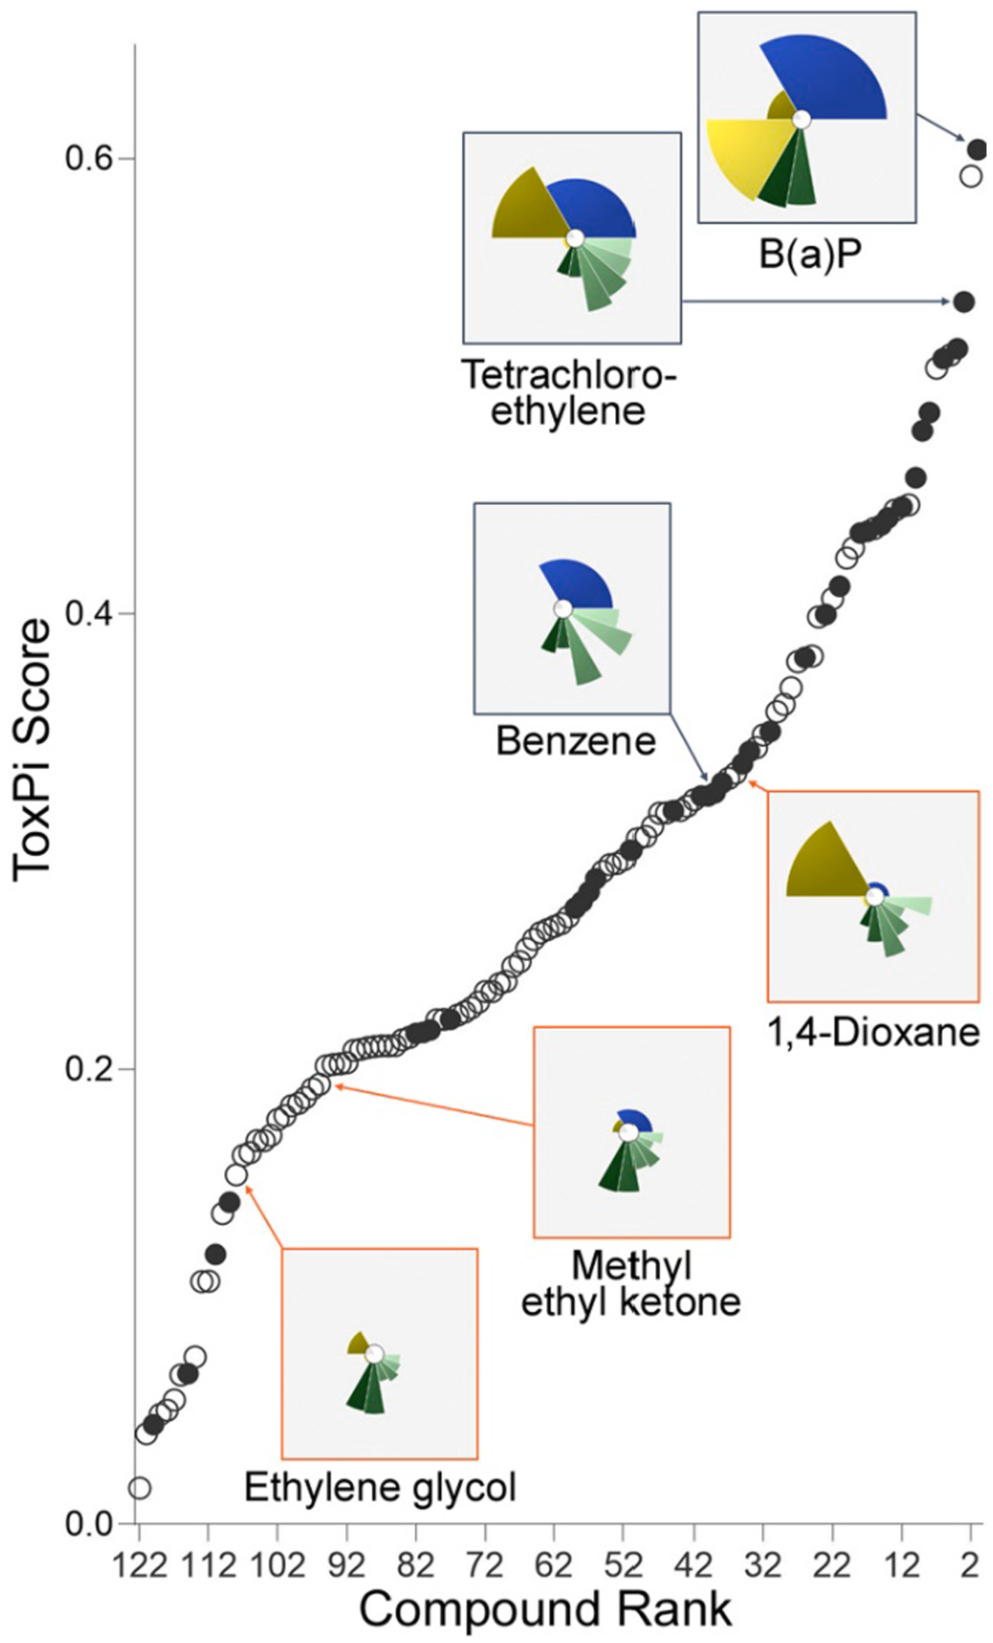
Distribution dot plot of ToxPi Scores for all 122 chemicals using the weighted analysis. The dots represent an individual chemical, whereas the 36 chemicals also listed on the EPA’s Priority Pollutant List (PPL) are denoted by a solid dot. Example ToxPi profiles are represented in the insets.