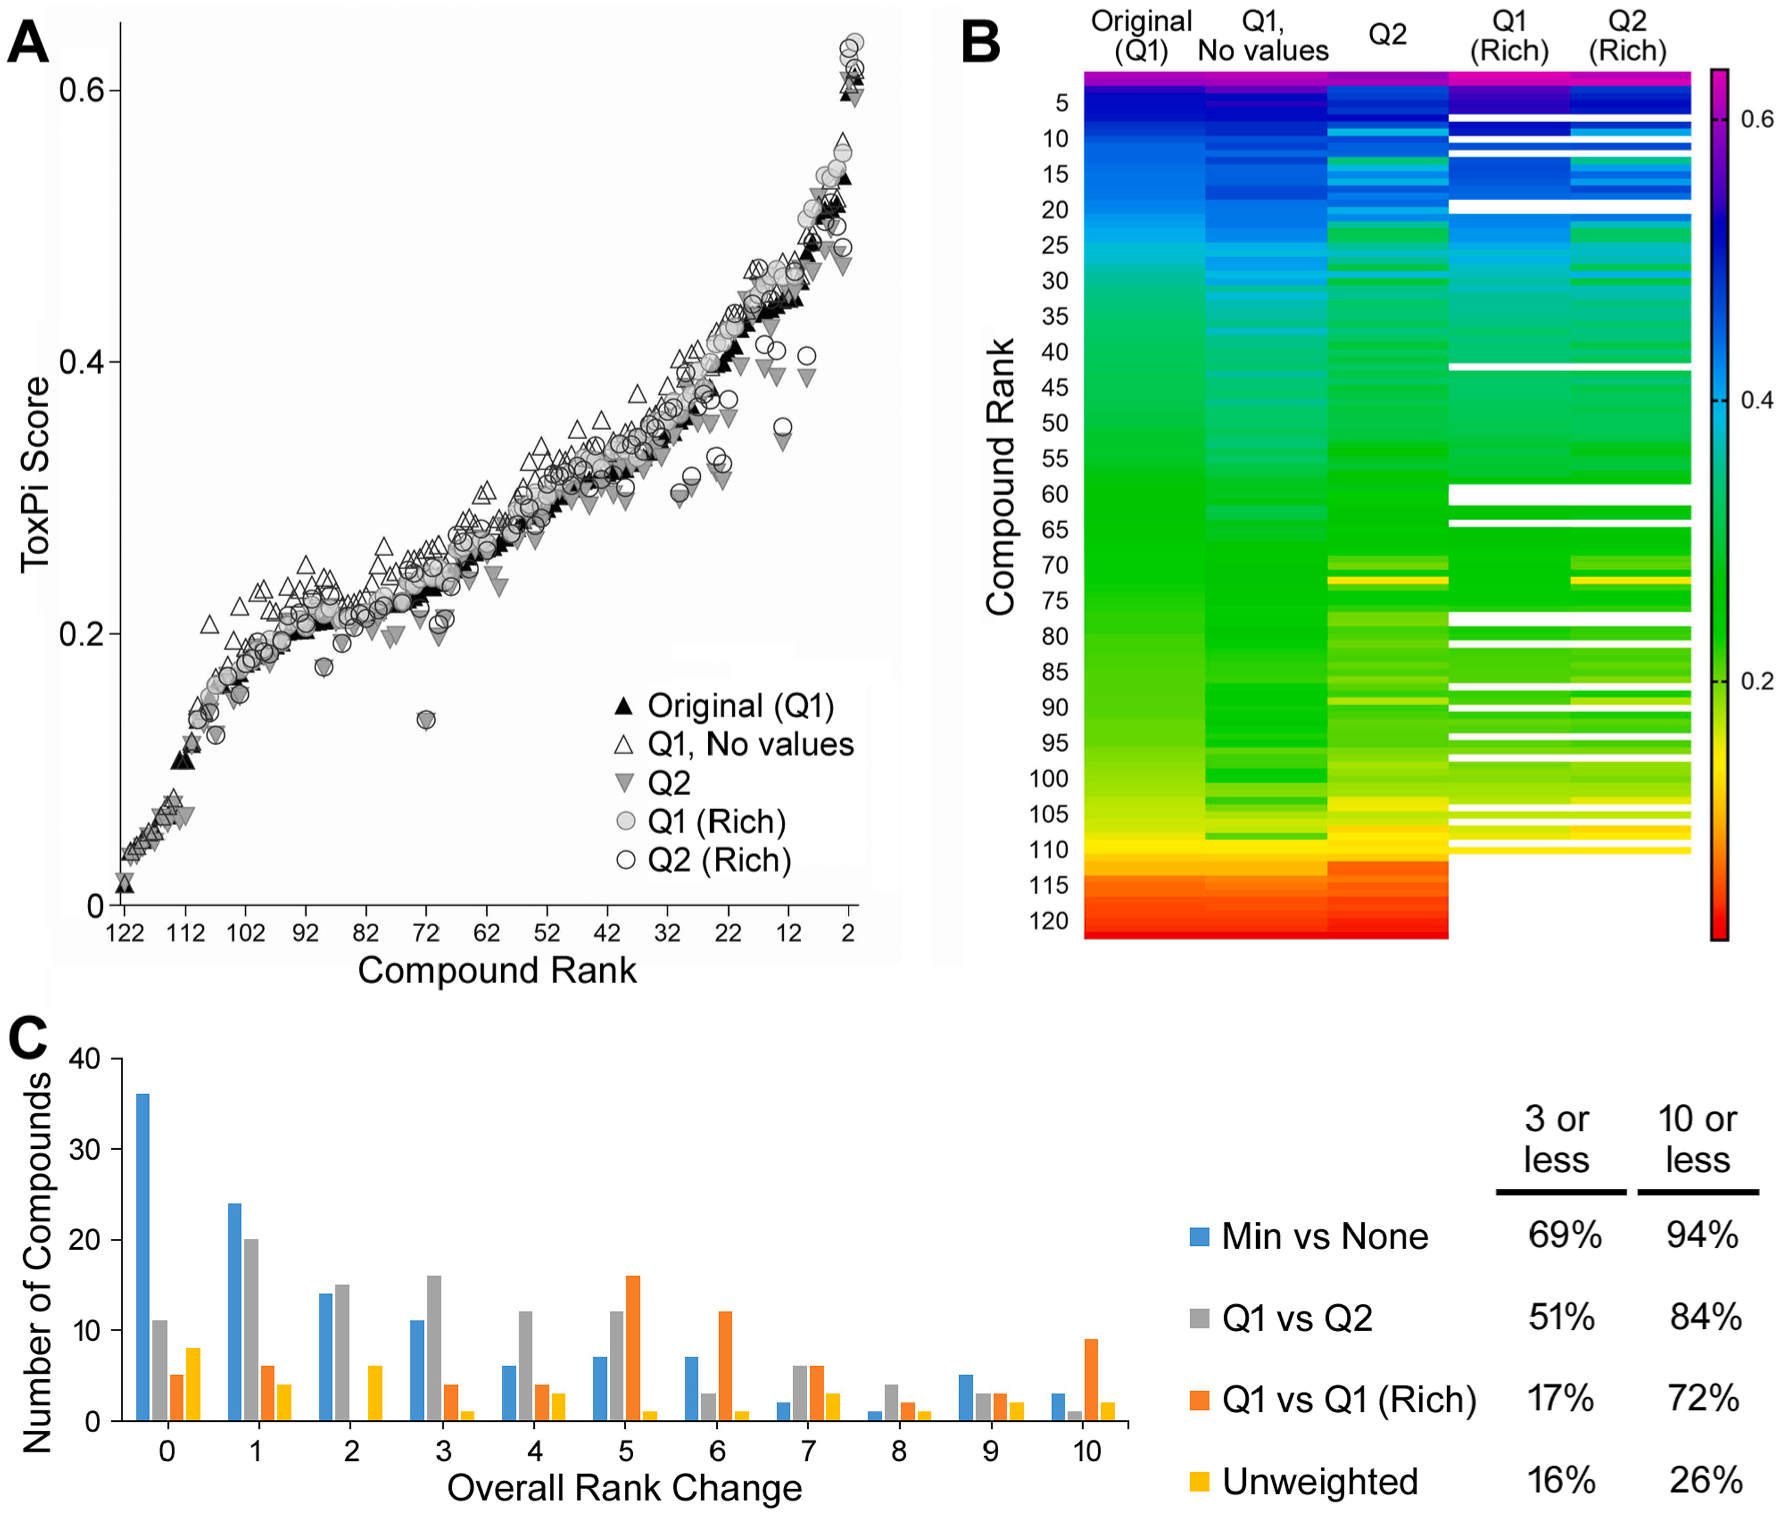
Fig. 8.

Sensitivity of ToxPi analysis. A: Sensitivity analysis comparing the rank versus ToxPi score of original weighted ToxPi analysis (Original, Q1) to imputing missing data using no values instead of the minimum in the main analysis (Q1, No values); using median values or geometric mean instead of the lower quartile and minimum values for both the ecotoxicity data and in vitro activity data for characteristic half-maximal concentrations (Q2); and including only data-rich chemicals defined as those having at least five out of nine component slices (Q1 and Q2 Rich). The rank derived in the original analysis was held constant to understand how the overall ToxPi score changed. B: A heat map of the same data derived in the sensitivity analysis to visualize change in rank order. C: Additionally, the sensitivity analysis examined how the overall rank changed using different weighting schemes in ToxPi that gave equal weight to each endpoint (unweighted) versus giving equal weight to each domain in the main analysis with using an unweighted analysis. The histogram indicates the total number of chemicals that moved rank (0–10) places.
