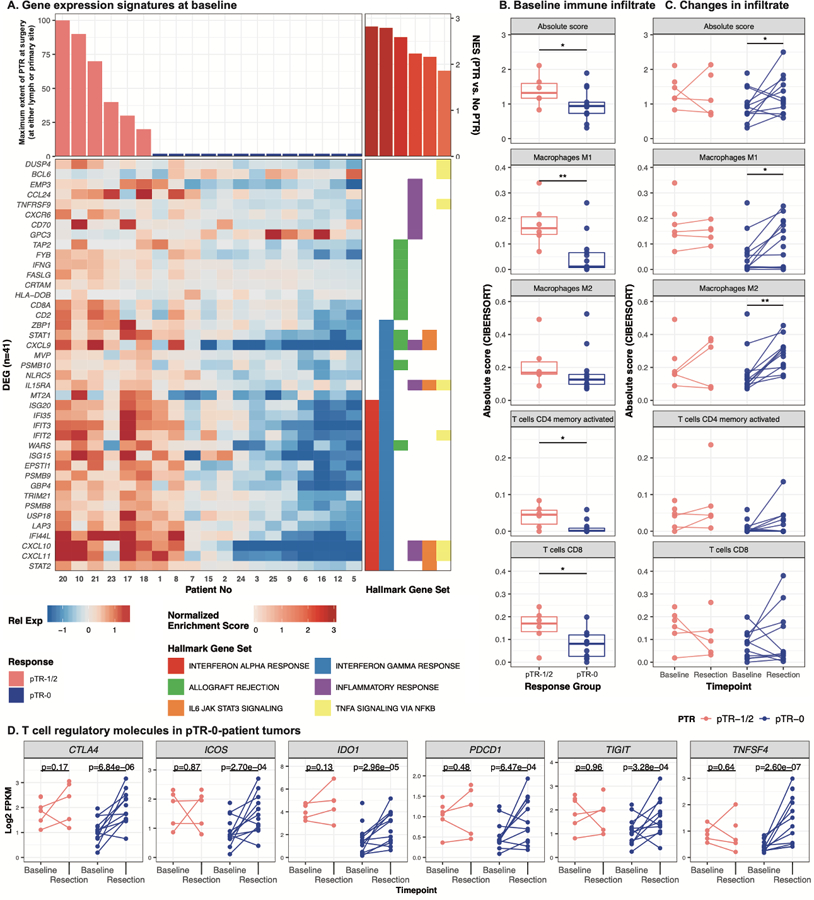
Figure 3. Immune infiltrate and activity correspond to patient response.

A. Heatmap shows genes (n=41) associated with hallmark gene sets (right panel) that were differentially expressed (p<0.01, adjusted p<0.25) between patients with PTR and those without at baseline. Genes are sorted first by hallmark geneset, then by Ward’s hierarchical clustering. Patients are sorted by decreasing maximum PTR (at either the tumor or lymph node site), then by Ward’s hierarchical clustering. Expression is displayed as the gene-normalized expression across samples. B–C. Baseline- and post-treatment RNA was assessed for patterns of infiltrating immune cells, and values were summarized by the absolute levels of immune cells. These are indicated as the sum of all immune cell populations (Absolute score) or by subpopulation at baseline (B). Matched samples were available for a subset of patients (n=15) and the changes over the course of treatment are depicted by connected lines between baseline and resection timepoints in (C). Wilcoxon tests were used to evaluate statistical significance across responder groups and timepoints; * indicates p<0.05. D. Expression (Log2 FPKM, y-axis) of six genes in baseline and post-treatment bulk tumor RNAseq data. Points and lines are colored by either PTR (pTR-1/2) or without (pTR-0). Paired samples per individual are connected by lines, and p-values (labeled above) indicate the comparison of paired pre- and post-treatment samples.
