FIGURE 2.

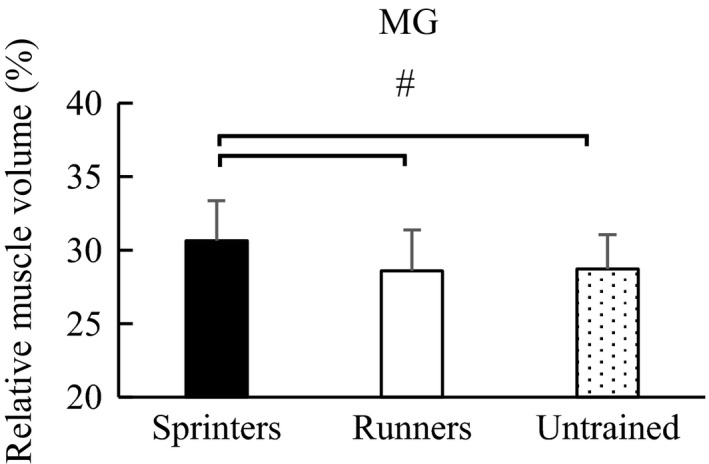
Post hoc analysis of relative muscle volume of MG among groups. #Significant difference between groups (p < .05). Error bars are shown as SD. MG, medial gastrocnemius

Post hoc analysis of relative muscle volume of MG among groups. #Significant difference between groups (p < .05). Error bars are shown as SD. MG, medial gastrocnemius