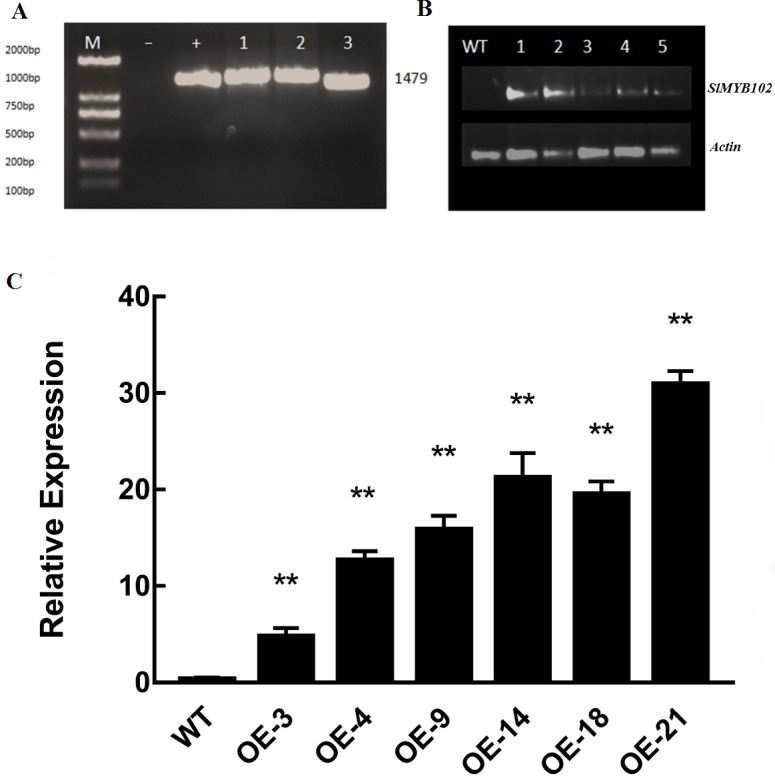
Figure 4. Validation of transgenic lines.

(A) PCR amplification of the recombinant gene (M: 2000 DNAMarker, -: negative control, +: bacterial positive control, 1-3: transgenic lines); (B) RT-PCR electropherogram; (M: 2000 DNAMarker, WT: wild type plants, 1-5: transgenic lines). (C) qRT-PCR was used to verify the expression of the SlMYB102 gene, with Actin as a normalization control. The data are means + SD (standard deviation) of three biological replicates analyzed by Student’s t-test; *P < 0.05; and **P < 0.01. Error bars represent standard deviation.
