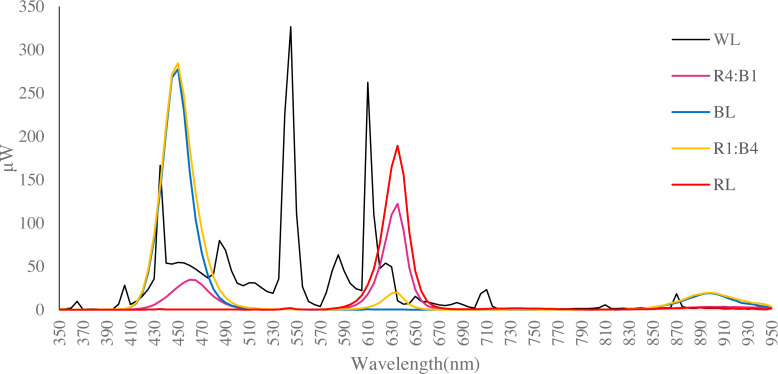
Figure 1. Spectral distribution of LED light sources utilised (data obtained using a Hopocolor OHSP-350SF Spectral Colour Luminance Meter).
Each line indicates the wavelength of the test light quality. WL is white light, R4:B1 is red:blue ratio is 4:1; BL is blue light, R1:B4 is red-blue 1:4; RL is red light.

