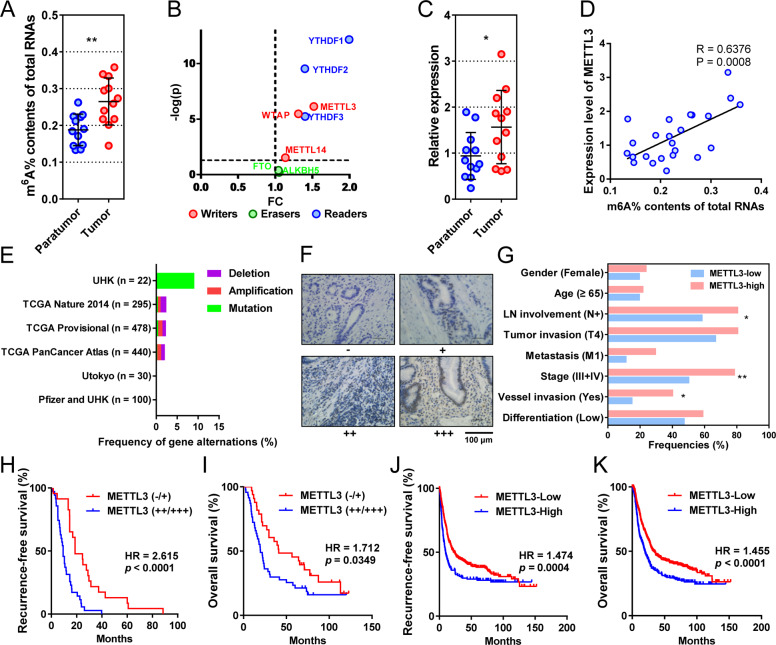
Fig. 1. METTL3 is overexpressed in gastric cancer and associated with poor prognosis in GC.
a m6A levels of total RNA derived from 12 pairs of cancerous and noncancerous tissues. b Differential expression (gastric cancer vs. normal tissue) of the m6A regulators in the TCGA-STAD database. The colors indicate the functional subgroups of the proteins. c Expression of METTL3 mRNA in 12 pairs of cancerous and noncancerous tissues. d Correlation between METTL3 mRNA levels (y-axis) and percentage of m6A content in total RNA (x-axis) in our clinical cohorts (n = 24). e Genetic changes of METTL3 in gastric cohorts from online databases. Original data were extracted from cBioPortal. f Representative IHC staining of METTL3 in GC tissues (100×). One representative sample of staining intensity (-), (+), (++), and (+++) were shown. Scale bars represent 50 μm. g Clinicopathologic features of patients with METTL3-low (n = 36) and high tumors (n = 51). h, i Kaplan–Meier plots of RFS (n = 58) and OS (n = 80) of patients with METTL3-low and high tumors according to IHC staining intensity. Data were derived from a gastric cancer cohort followed-up by us. j, k Kaplan–Meier plots of RFS (n = 641) and OS (n = 876) of patients with METTL3-low and high tumors according to mRNA levels. Data were interrogated from the GEO datasets GSE14210, GSE15459, GSE22377, GSE29272, GSE38749, GSE51105, and GSE62254 with the probe 209265_s_at. Data are presented as mean ± SD. *P < 0.05; **P < 0.01.

