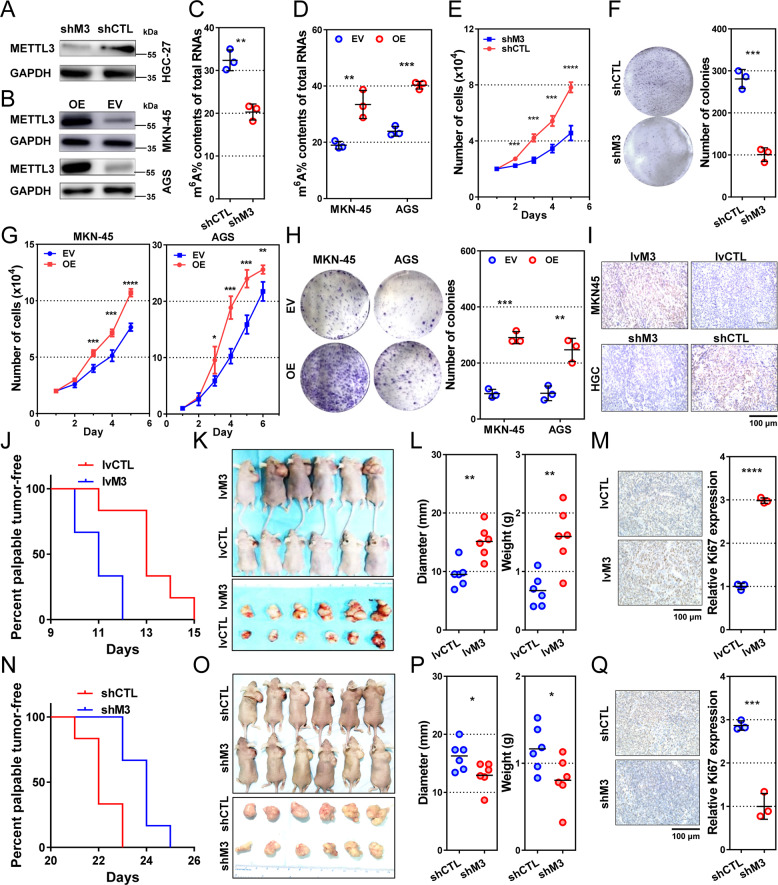
Fig. 2. METTL3 promotes gastric cancer cell proliferation and tumor growth.
a METTL3 expression in HGC-27 cells transfected with lentivirus encoding shRNA against METTL3 (shM3) and control (shCTL). b METTL3 levels in MKN-45 and AGS cells transfected with overexpressing plasmid (OE) or empty vector (EV). c, d Percentage of m6A content in total RNA in METTL3-reducing HGC-27 and METTL3-overexpressing MKN-45 and AGS cells. e Proliferation curves of METTL3-reducing HGC-27 cells. f Colony-formation assays of METTL3-reducing HGC-27 cells. Representative plates are shown on the left, and quantification on the right. g Proliferation of METTL3-overexpressing MKN-45 and AGS cells. h Colony-formation assays of METTL3-overexpressing MKN-45 and AGS cells. n = 3 for each group in c–h. i METTL3 expression in xenograft tumors derived from stable cell lines transfected with lentivirus encoding METTL3 (lvM3, MKN-45 cells), shM3 (HGC-27 cells), and their corresponding controls (lvCTL and shCTL). j Kaplan–Meier plots of palpable tumor-free survival in METTL3-high (n = 6) and control (n = 6) MKN-45 cell xerographs. k Tumor-harboring mice (top) and xenograft tumors (bottom) 3 weeks post-implantation of METTL3-overexpressing and control MKN-45 cells. l Diameter (left) and weight (right) of METTL3-high and control MKN-45 tumors. Each dot represents one sample. m Ki67 levels of METTL3-high and control MKN-45 tumors. n Kaplan–Meier plots of palpable tumor-free survival in METTL3-low (n = 6) and control (n = 6) HGC-27 xerographs. o Tumor-harboring mice (top) and xenograft tumors (bottom) 35 days post-inoculation of METTL3-reducing and control HGC-27 cells. p Diameter (left) and weight (right) of METTL3-low and control HGC-27 tumors. Each dot represents one sample. q Ki67 levels of METTL3-low and control HGC-27 tumors. Data are presented as mean ± SD. *P < 0.05; **P < 0.01; ***P < 0.001; ****P < 0.0001.

