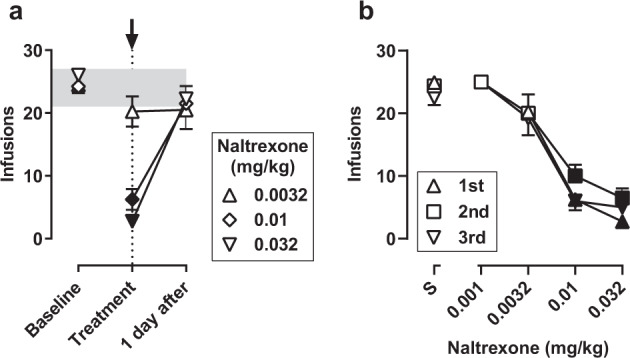
Fig. 1. Time- and dose-dependent effects of naltrexone on fentanyl self-administration.

a Time course of effects of naltrexone on fentanyl self-administration (n = 4). The number of fentanyl infusions per session is plotted across three consecutive sessions: immediately preceding a test (“Baseline”), 15 min after an injection of naltrexone (“Treatment”), and 1 day after an injection of naltrexone (“1 day after”). Each symbol indicates a test with a different dose of naltrexone. The shaded region shows the range across baseline sessions for individual monkeys, and the arrow and vertical dashed line indicate the day on which naltrexone was administered. b Naltrexone dose–effect curves plotted for each of three determinations during the course of the study (n = 4, except as indicated below). The mean number of fentanyl infusions is plotted for pretreatment with saline (above S) and increasing doses of naltrexone. All monkeys were tested with 0.0032, 0.01, and 0.032 mg/kg for the first determination. The range of doses tested varied across monkeys for the second and third determinations depending on effects of naltrexone, as follows: second determination, 0.001 mg/kg (n = 1) and 0.032 mg/kg (n = 2); third determination, 0.001 mg/kg (n = 1) and 0.032 mg/kg (n = 1). For both panels, symbols represent the mean (±1 SEM); filled symbols indicate data that are significantly different from baseline (a) or saline (b) according to a Dunnett’s test (p < 0.05).
