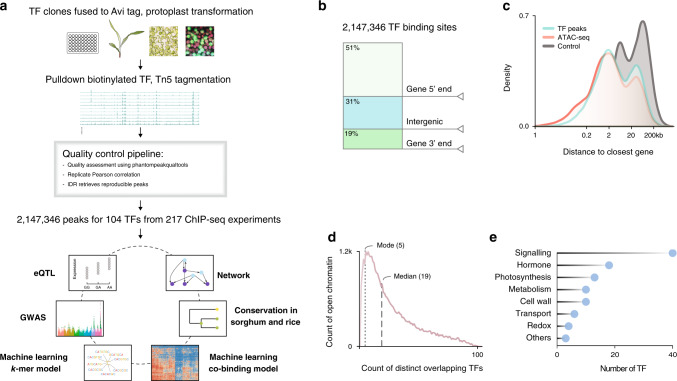
Fig. 1. The transcription regulatory landscape of the maize leaf.
a Overview of the experimental and analytical approaches. b Genome-wide distribution of TF-binding loci. c Density plots corresponding to distances of TF-binding sites (green) and open chromatin regions (red) to closest annotated gene. Gene-to-gene distant is used as a control (gray). d Distribution of the number of TFs-binding sites in open chromatin region. e Functional classification of the 104 TF based on their target genes. The height of the bar indicates the number of TF associated with each MapMan category.

