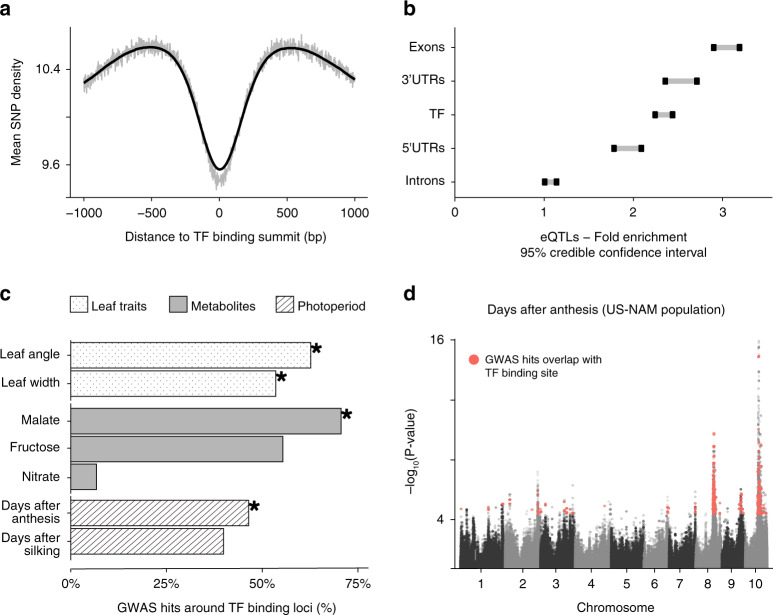
Fig. 3. TF-binding sites show low sequence diversity and enrichment in functional variation.
a Distribution of the average SNP count in maize inbred lines around TF peaks (bin size: 100 bp). The smooth line corresponds to a sliding window of 100 positions to average the mean SNP counts. b 95% confidence interval for the enrichment of eQTLs from a previous study21 vs. non-eQTLs SNPs, and relative to control regions for different sets of genomic regions (TF n = 144,890, exons n = 403,199, 3′ UTR n = 138,793, 5′ UTR n = 146,120, introns n = 151,414). c Proportion of phenotype-associated GWAS hits for an assortment of traits overlapping to TF-binding loci. Traits in which the enrichment was statistically significant (adj-P < 0.05) are labeled with an asterisk. d Manhattan plot of GWAS for days after anthesis. GWAS hits overlap with binding regions for a group of TFs previously associated with photoperiod variation are highlighted in red. Source data underlying Fig. 3c are provided in a Source Data file.

