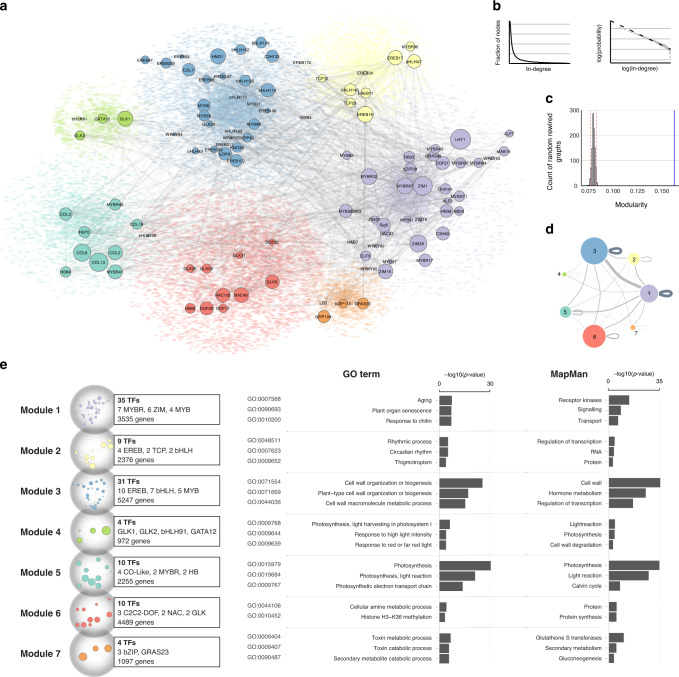
Fig. 4. The maize transcription regulatory network exhibits properties of real-world networks.
a Graph diagram showing the maize transcription regulatory network. The seven modules are labeled in different colors. TF nodes are shown as circles with size representing their expression level, and their target genes are shown as colored dots in the background. TF-to-TF edges are shown as gray lines between nodes. b Distribution of node in-degree values fits the power-law (dashed line). c Modularity of the network (blue line) is higher than the random control (histogram of maximum modularity values of 1000 rewired graphs). d Graph diagram showing TF-to-gene connections within and between modules. Each module is represented as a circle with size proportional to the number of nodes within. e GO-term and MapMan category enrichment analysis of genes in each module. Source data underlying Fig. 4e are provided as a Source Data file.

