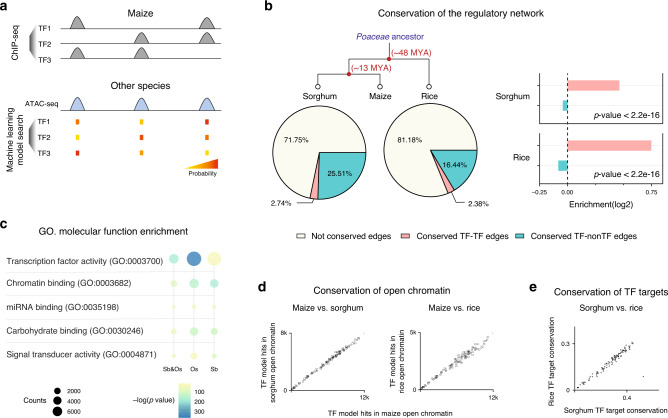
Fig. 7. Conservation of the TF regulatory interactions.
a Schematic diagram showing how the TF binding k-mer model is used to search the open chromatin regions of maize synteny gene in other species, to infer conservation of the regulatory interaction. b Pie chart showing percentage of conserved edges in sorghum (left) and rice (right), and bar plot showing TF-to-TF edges are more conserved than TF-to-non-TF edges (P value; two-sided Fisher exact). c Diagram showing enriched GO-terms for conserved maize TF-target genes. From left to right: conserved in both sorghum and rice, conserved in rice and conserved in sorghum. The size of the circle indicates the number of genes, and the color is scaled to −log10(P val) (two-sided Fisher exact). d Number of recognition sequences of each TF predicted in maize, sorghum, and rice open chromatin. e The axis indicates the percentage of target conservation of each maize TF in rice and sorghum, inferred from the TF model matches in their synteny target gene open chromatin.

