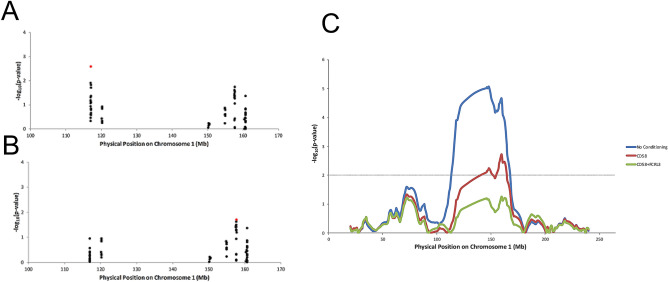
Figure 1.
Two variants are sufficient to explain the admixture association signal. (A,B) Top GWAS variants in the region of the admixture association signal (red box) were taken and used in a logistic regression for genotype association on MS case–control status in African-American data after conditioning on global and local European ancestry. Y-axis is − log10 (p-value) of association with MS case status. Shown in red are the most highly associated variants, rs12025416 in the CD58 gene for (A) and rs6681271 in the FCRL3 gene in (B) (after conditioning on the top variant in A). (C) Logistic regression of local European ancestry on case–control status in African-American data after controlling for global ancestry as a covariate as well as the top variants from (A,B). No conditioning indicates only controlling for global ancestry. The dotted line indicates threshold for significance (this p-value threshold represents a lower bound on significance due to the fact that the peak can shift after conditioning). The African-American data used for all analyses was the 2007 subset of the new cohort.

