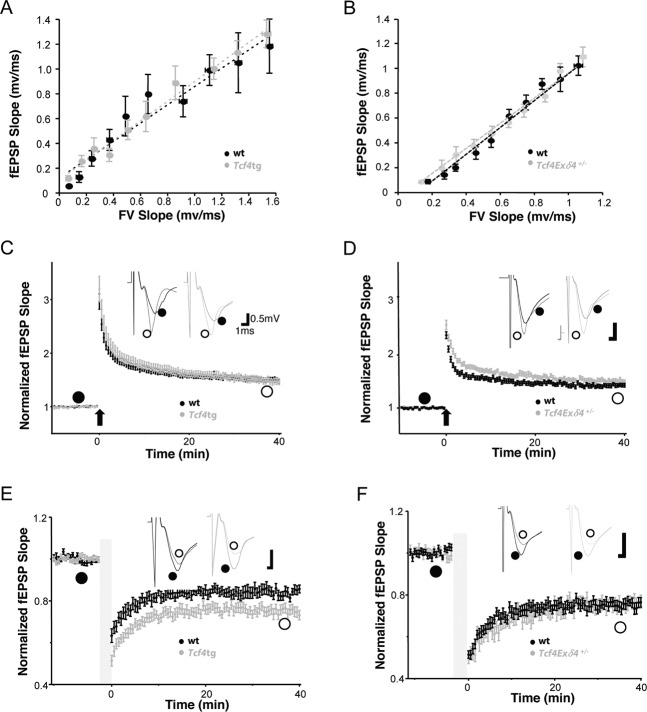
Fig. 3. The expression level of Tcf4 regulates long-term synaptic plasticity without change in basal synaptic transmission.
Electrophysiological characterization of Tcf4tg (a, c, e) and Tcf4Ex4δ+/− mice (b,d,f). Values from Tcf4tg and Tcf4Ex4δ+/− are plotted in gray and those from littermate wt controls in black, respectively. a, b) Input/output relationship of excitatory synapses examined using extracellular field potential recording in the stratum radiatum layer CA1 regions of acute hippocampal slices from Tcf4tg and wt (a) and Tcf4Ex4δ+/− and wt mice (b). A summary plot of the slope of the field excitatory postsynaptic potential (fEPSP) in mV/ms versus the fiber volley (FV) indicates no differences between the genotypes. Tcf4tg n = 28, wt n = 32; (a) and Tcf4Ex4δ+/− n = 24, wt n = 15; (b). c Superimposed pooled LTP data showing the normalized changes in fEPSP slope. LTP induced by strong stimulation (100 Hz x 1) for 1 s in CA1. The fEPSP slope was measured and expressed as a mean percentage against time. The levels of LTP are unchanged in Tcf4tg mice (effect of genotype, p = 0.186). Summary graphs of LTP obtained by extracellular field recordings in CA1 stratum radiatum of acute hippocampal slices from Tcf4tg and wt mice (n = 28 and 32 slices, respectively). d Superimposed pooled LTP data showing the normalized changes in fEPSP slope. LTP induced by strong stimulation (100 Hz x 1) for 1 s in CA1. Summary graphs of LTP obtained by extracellular field recordings in CA1 stratum radiatum of acute hippocampal slices from Tcf4Ex4δ+/− mice and wt controls (n = 22 and 34 slices, respectively) showing significantly increased LTP in Tcf4Ex4δ+/− mice (effect of genotype, p < 0.001). e Superimposed pooled LTD data showing the normalized changes in fEPSP slope. LTD triggered by low stimulation (1 Hz) for 15 min. Summary graphs of LTD in the acute hippocampal slices from Tcf4tg and wt mice (n = 24 and 15 slices, respectively). LTD is significantly increased in Tcf4tg mice (effect of genotype, p < 0.001). f Superimposed pooled LTD data showing the normalized changes in fEPSP slope. LTD triggered by low stimulation (1 Hz) for 15 min. Summary graphs of LTD in the acute hippocampal slices from Tcf4Ex4δ+/− and wt mice (n = 29 and 20 slices, respectively). LTD is unchanged in Tcf4Ex4δ+/− mice (effect of genotype, p = 0.143). Data represent mean ± SEM. LTP, long-term potentiation; LTD, long-term depression; fEPSP, field excitatory postsynaptic potentials. wt, filled black circles; open gray circles represent Tcf4tg, (c, e) or Tcf4Ex4δ+/− (d, f) vs littermate wt animals 4–5 weeks of age, respectively.

