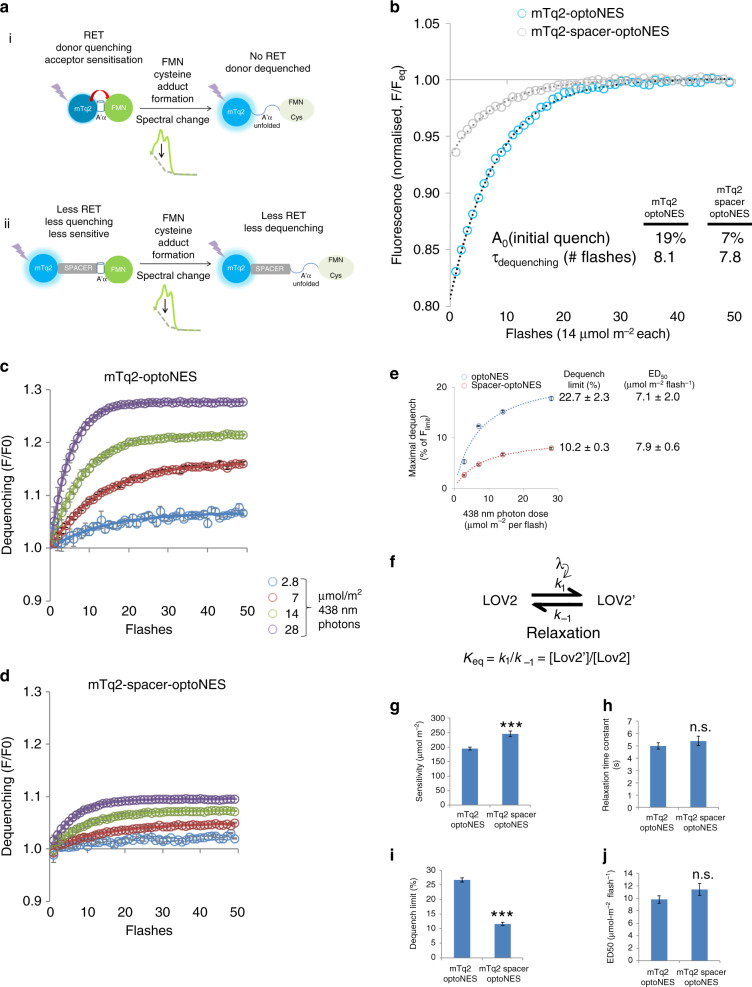
Fig. 2. Dequenching of mTurquoise2 as a measurement of LOV2 activation.
a (i) LOV2 domain-fused mTq2 can act as a RET donor and transfer energy to FMN in the adjacent domain, and is partially quenched. Once LOV2 is activated directly or via RET, formation of FMN-adduct changes the absorption spectrum, reducing its ability to act as a RET acceptor. The LOV2 domain A’α helix extends, placing the FMN and LOV2 domain further from the fluorescent protein, also reducing RET. Thus mTq2 becomes dequenched; (ii) Placing a spacer between mTq2 and the LOV2 domain reduces RET from the outset, limiting initial quenching and the corresponding dequenching on LOV2 activation. b Changes in fluorescence emission of mTq2 fusion proteins, mTq2-optoNES, and mTq2-spacer-optoNES (Supplementary Fig. 8) expressed in HEK293 cells, are observed during 50 flashes of 14 µmol m−2 438 nm light at ~4 Hz. This replicate illustrates LOV2-dependent dequenching, with exponential fits yielding decay constants of 0.12 and 0.13 per flash i.e. τ ~8 s and differing levels of maximal dequench (or initial quench, A0); c, d Means ± SEMs (n = 3 wells) of samples as shown in b were exposed to photon doses per 438 nm flash as indicated. Dequenching curves were corrected in all cases to the signal from a parallel free mTurquoise2 sample exposed to identical illumination conditions (Supplementary Fig. 10), normalised to the first data point and then plotted against flash number. Data were fitted to exponentials to derive fluorescence prior to illumination, maximum fluorescence and rate constants. e Data from c, d, fitted to exponentials, show the relation between maximal dequench and photon dose. Fitting to a single site model provides estimates of dequench limit i.e. the extent to which the Tq2 is originally quenched, and ED50 the photon dose/flash to achieve half this dequenching at equilibrium when delivered at ~4 Hz. f All data points were fitted to a first order reversible kinetic model, providing more reliable estimates of g sensitivity (1/k1), h relaxation time constant during illumination, i Dequench limit and j ED50. ***n.s. indicate significant difference (P < 0.0001) and no significant difference by unpaired one-tailed multiple t-test with Holm–Sidak correction. Source data are provided as a Source Data file.

