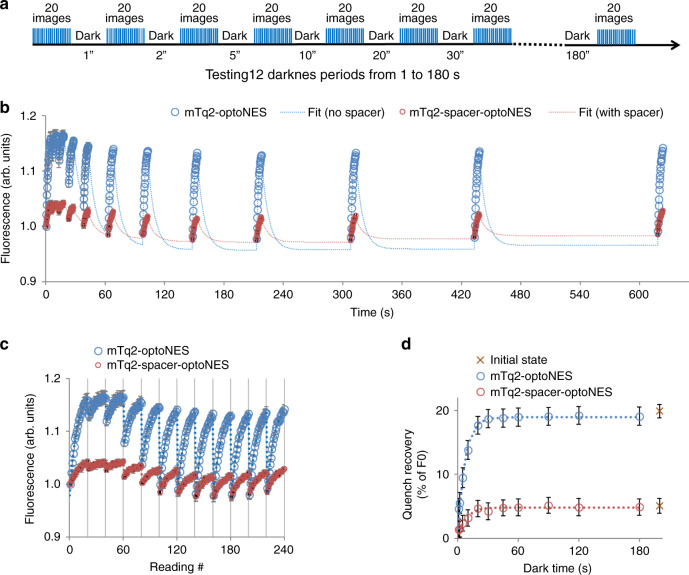
Fig. 3. Direct quantification of relaxation time as recovery from dequenching of mTurquoise by LOV2.
a Illumination strategy to map LOV2 switching (changes in quenching) during illumination and relaxation-induced dequenching in darkness. Samples were exposed to 20 flashes (14 µmol/m2 438 nm) at ~4 Hz followed by 1–180 s darkness. b HEK293 cells expressing mTq2-optoNES (blue symbols) or mTq2-spacer-optoNES (red symbols) were imaged during the flash sequence as in a to induce dequenching followed by 12 sequentially increasing dark periods, allowing relaxation. The whole 240 image sequence was repeated three times per sample to reduce noise. Responses from each segmented cell (region of interest) in the field and from each repeat were averaged. All wellwise-averaged data from transfected cells are normalised to an average of replicates for a corresponding mTurquoise-expressing sample (without LOV2) exposed to the same illumination conditions (Supplementary Fig. 10). Means are plotted against reading number. Each dequenching phase was fitted to an exponential as in Fig. 3, with independent size and common activation rate constant for each protein, providing offset and amplitude estimates for each cycle. These curves, together with the dark-phase changes are shown as a solid line between the data points, showing goodness of fit. Apparent activation rate constants at this photon flux were 0.12 and 0.11 per flash, equivalent to a photon sensitivity of 115 and 131 µmol/m2. c The same data as in b is plotted against reading number to more easily visualise the responses. Each grid-line represents an increasingly long dark period as shown in a, b. d The quench recovery estimated from the exponential curve fits in b/c, is plotted against the duration of dark time causing the quench. This reveals the time-dependence of recovery from dequenching. The data is fitted to an exponential to derive relaxation time constants (~7 s for both constructs) and dequenching maxima. As evident from b and c, the dequenching is at maximum ~19 and 5% of initial fluorescence for mTq2-optoNES and the spacer construct respectively. Source data are provided as a Source Data file. Data are presented as means ± SEM; n = 6 wells for mTq2-optoNES and n = 5 wells for mTq2-spacer-optoNES.

