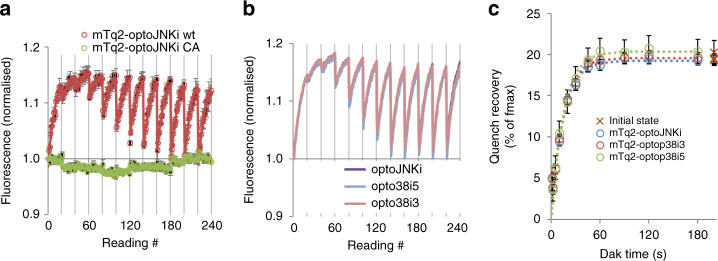
Fig. 5. Apparent activation rates, dark state relaxation rates and calculated sensitivities of selected Lov2-based actuators fused to mTurquoise2.
a The optogenetic JNK inhibitor optoJNKi fused to mTq2 is evaluated using light-dark cycles as in Figs. 3–4 and compared with a C450A mutant version (green) that cannot form a cysteine adduct and therefore cannot cycle, as shown. Means ± SEM (n = 3 wells) are plotted together with a series of exponential fits with a common activation constant (red line); b mTq2 fusions of optoJNKi, optop38i3 and optop38i5 are evaluated and the response curves show almost complete overlap. Raw averaged data (n = 3 wells) is shown for each construct; c Best-fit amplitudes (±S.E.) of exponentials fitted to the data in b are plotted against preceding dark time; crosses plotted nominally at 200 s represent the amplitudes of the first exponential which was not preceded by any light exposure. These data are fitted to exponentials to derive the relaxation time in dark and maximal dequench (as % of initial signal) for each construct under the low illumination conditions used (14 µmol m−2 flash−1 at ~4 Hz). Max dequench (as % of total), apparent activation rates, and relaxation time constants in dark for the data in b, c are shown in Table 1A. From these values, ED50, dequench limit (equivalent in each case to FRET efficiency, assuming adduct has no effect) and sensitivity are derived. The C450A optoJNKi construct, which cannot form an adduct and therefore for which no activation or relaxation values could be derived, is also listed in the table. Source data are provided as a Source Data file.

