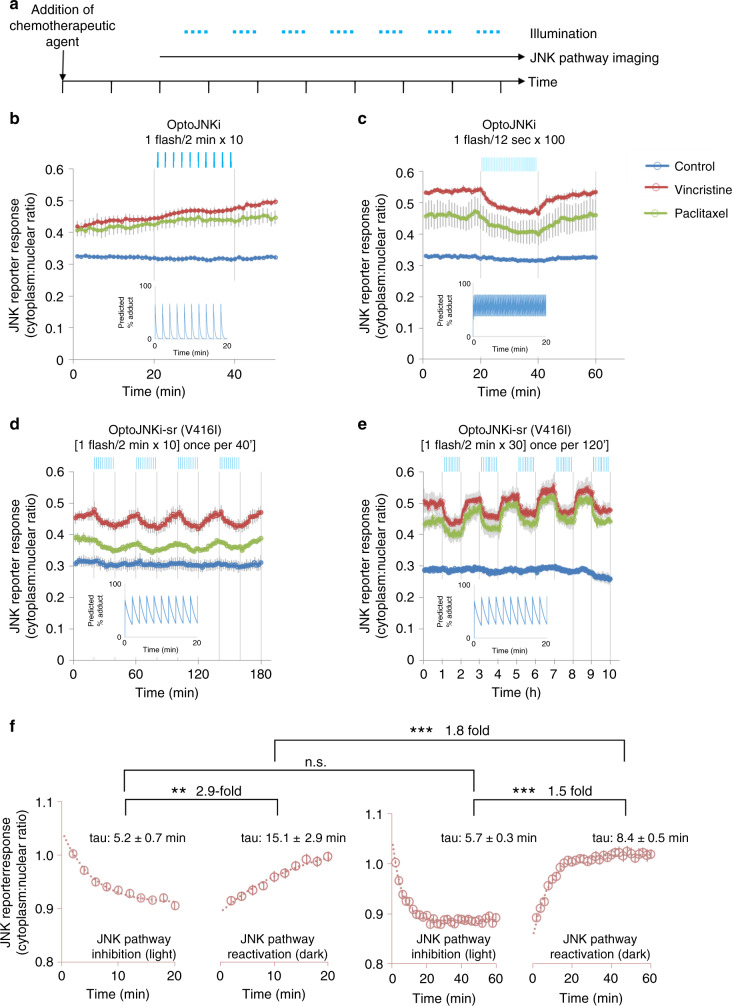
Fig. 9. Optimisation of relaxation in optoJNKi-sr increases sensitivity and experimental throughput tenfold, facilitating investigation of bidirectional pathway dynamics in intact living cells.
a Neurons expressing mTq2-optoJNKi and miRFP670-JNKktr were exposed to chemotherapeutics (Vincristine and Paclitaxel, 100 nM each). The JNK pathway was measured during alternating periods of blue light flashes and darkness; b After 6 h, JNK reporter activity increases steadily. Using the original optoJNKi, blue light (420 µmol m−2 438 nm every 2 min, 8.3 mHz, vertical blue lines) has no affect. Predicted adduct levels decay rapidly after each flash (inset); c 11 h after addition of chemotherapeutics, the reporter response has stabilised, and tenfold increased flash rate (every 12 s, 83 mHz) achieves detectable slow reduction of JNK reporter response, consistent with adduct prediction (inset). The reporter response gradually recovers in darkness; d Experiments in c are repeated using optoJNKi-sr, harbouring AsLOV2-V416I in as in Fig. 8, slowing relaxation tenfold (Supplementary Fig. 14). The lower flash rate (8.3 mHz) is now sufficient to maintain substantial adduct state (inset) and inhibit the pathway, as judged by the reporter readout, while reducing tenfold both photon dose and time spent on an imaging field. The latter permits the imaging of multiple samples in parallel (12 here compared with only 1 in b, c. e Samples, 11 h after chemotherapeutic addition, were imaged as in d with an extended actuation period (60 min every second hour) repeated five times. Inhibition and recovery reaches equilibrium in lit and dark phases. f The averaged JNK pathway reporter responses to light in d, e were fitted to exponentials with best-fit time constants shown (tau) as estimates of the reduction and recovery rates of reporter activity. Comparison of time-constants by F-test indicates significant two- to threefold differences between rates of inhibition and reactivation 20’ later (F(1,15) = 13.46) and of reactivation after 20’ vs. after 60’ inhibition (F(15, 55) = 9.611), suggesting different reactivation mechanisms depending on the duration of inhibition. The small difference between inhibition and reactivation rate at 60’ is also seen (F(1,55) = 39.61). ***P < 0.0001, **P = 0.0023, n.s. not significant. Source data are provided as a Source Data file. Means ± SEM (n = 4 wells) are shown in b–e.

