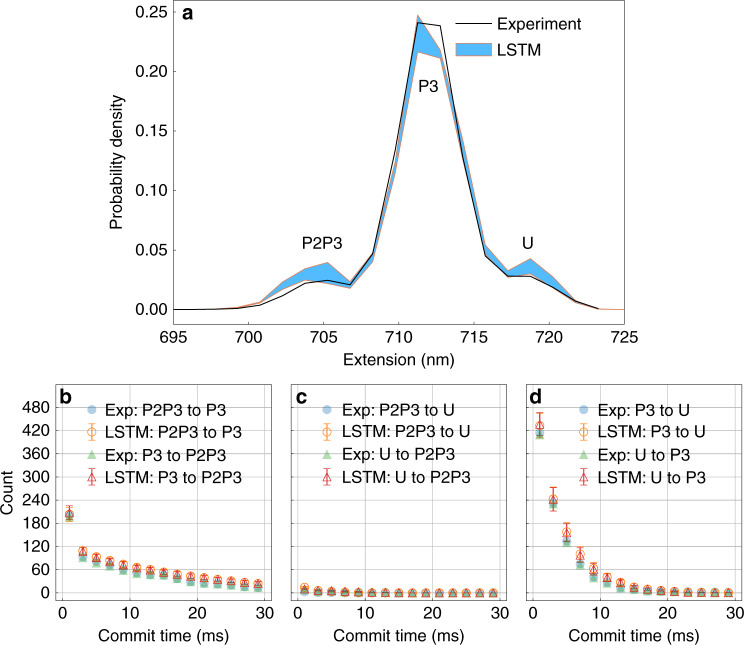
Fig. 6. Boltzmann statistics and kinetics for riboswitch.
Using LSTM model to learn thermodynamics and kinetics from a folding and unfolding trajectory taken from a single molecule force spectroscopy measurement20: a Comparison between the probability density learned by the LSTM model and calculated from the experimental data. The regions between errorbars defined as standard errors are filled with blue color. b–d Commit time plots calculated by counting the transitions in the trajectory generated by LSTM and the experimental trajectory. The commit time is the minimum time that must be spent by the trajectory in a given state to be classified as having committed to it. Error bars are illustrated and were calculated as standard errors.

