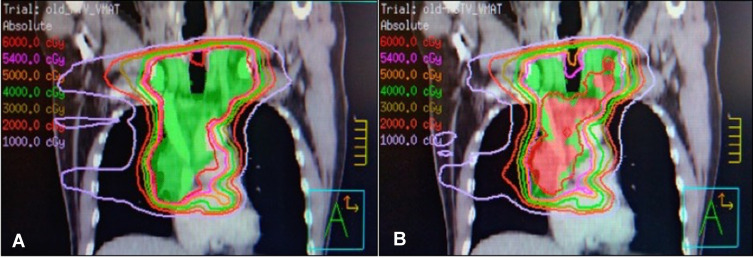
Figure 1.
The comparison of isodose lines distribution about the PTV/PGTV and the OAR in the C-VMAT plan (A) and the SIB-VMAT plan (B) from one patient. The isodose lines are presented by various colors: 6000cGy (red), 5400cGy (pink), 5000cGy (orange), 4000cGy (green), 3000cGy (olive), 2000cGy (tomato) and 1000cGy (lavender).

