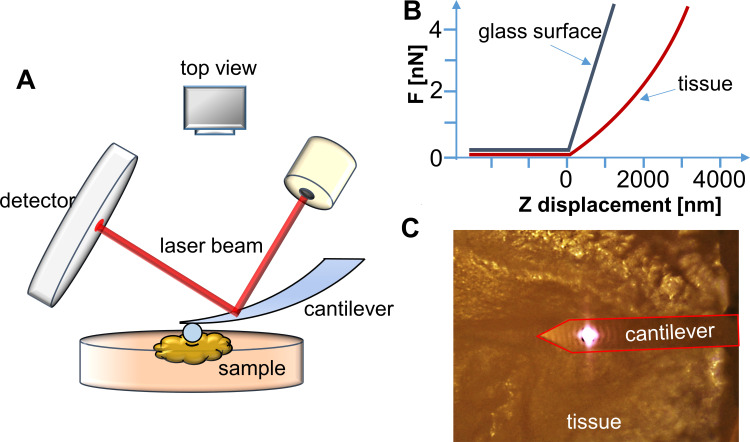
Figure 1.
(A) Schematic representation of the experimental setup for AFM tissue measurements. (B) Force vs displacement curve registered when force is applied to reference (glass surface) or investigated (tissue) sample. (C) Real (top view) image of the AFM cantilever placed over the tissue sample from the camera (objective 10×).

