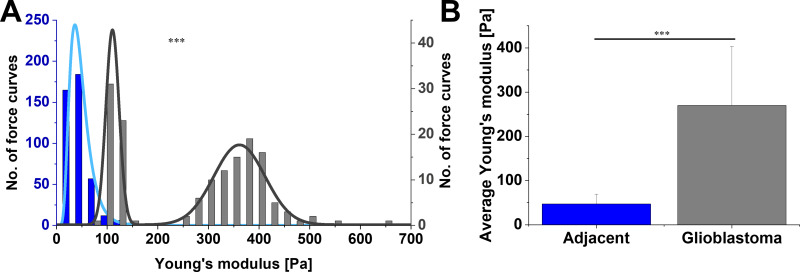
Figure 4.
(A) Distribution and (B) average values of Young’s modulus for margin adjacent to glioblastoma and glioblastoma tissue acquired from the same patient and calculated at 2 µm indentation depth. In A, the left axis (blue) is referring to adjacent tissue and the right axis (gray) to glioblastoma. Kolmogorov–Smirnov test and unpaired Student’s t-test were used to confirm statistical differences between two sets of data. ***p≤0.001.

