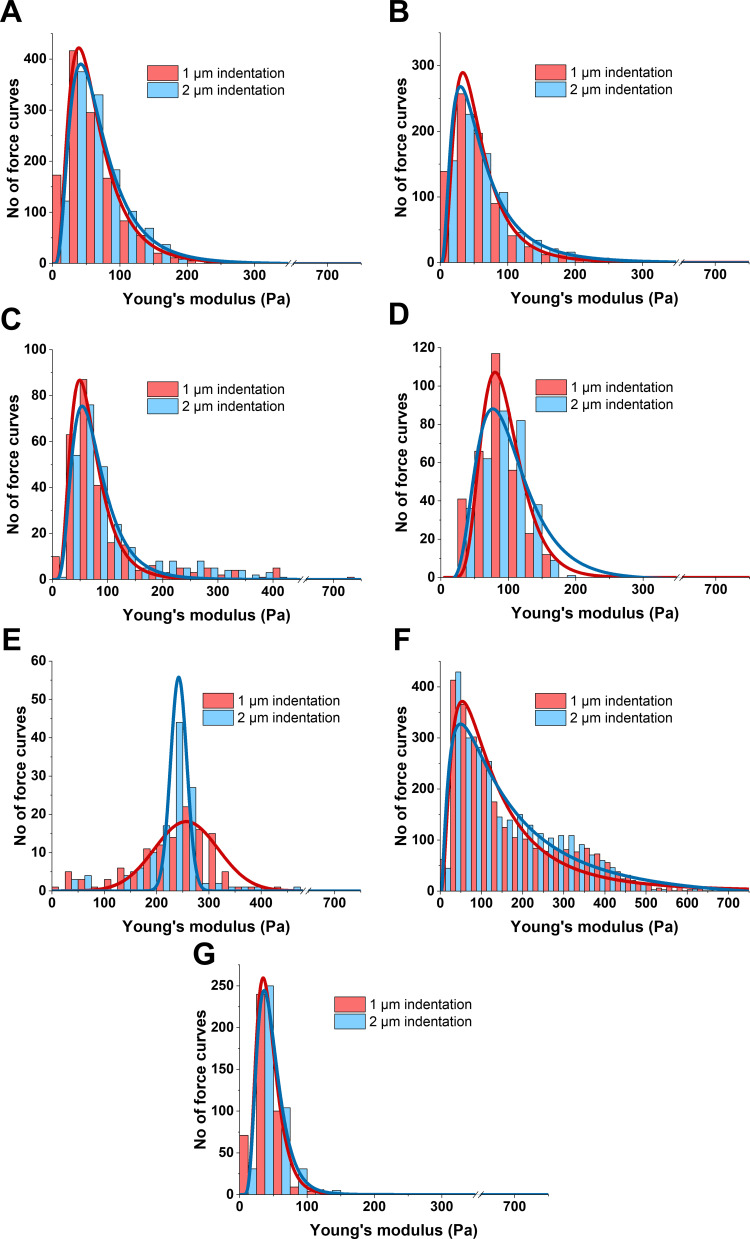
Figure 5.
Distribution changes in Young’s modulus for (A and G) healthy and (B–F) neoplasm brain tissue calculated at different indentation depths (1 and 2 µm). (A) Healthy tissue (white and gray matter); (B) meningothelial meningioma WHO G1; (C) fibrous meningioma WHO G1; (D) hemangiopericytoma WHO G2; (E) metastatic adenocarcinoma; (F) glioblastoma WHO G4; (G) margin tissue adjacent to glioblastoma.

