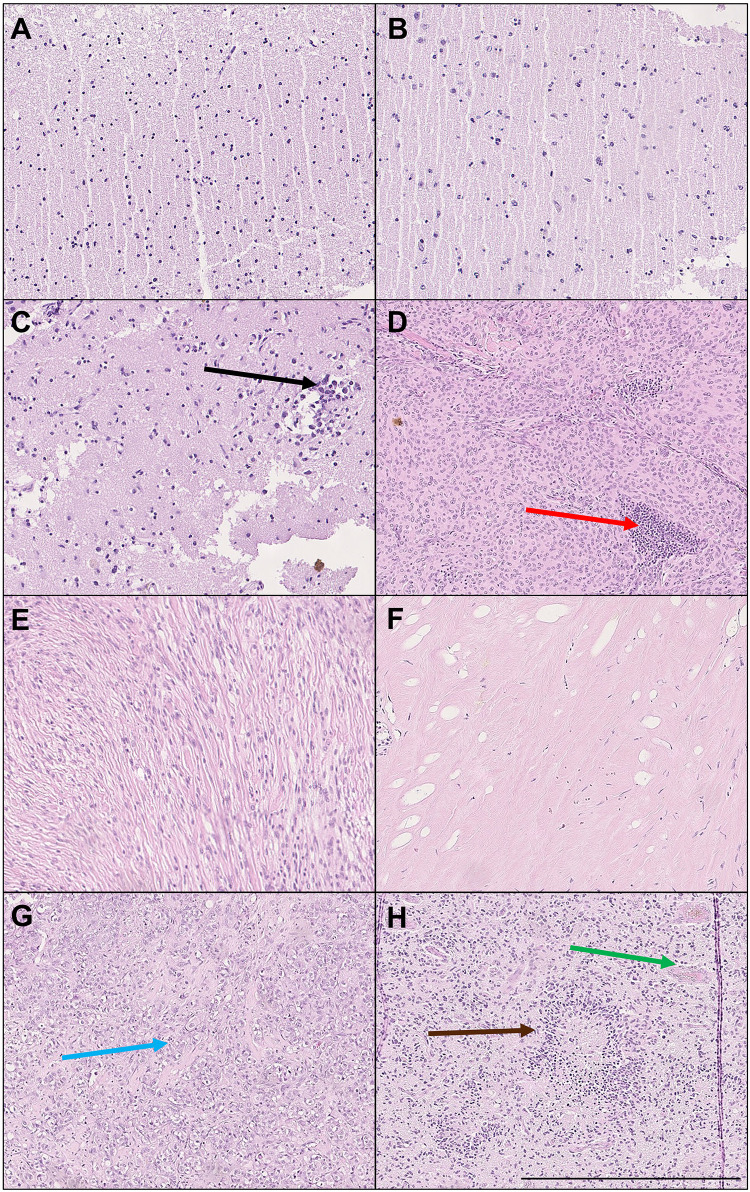
Figure 6.
Histopathological analysis of healthy brain tissue and CNS neoplasms. H&E staining of (A) white matter, (B) gray matter, (C) margin tissue adjacent to glioblastoma WHO G4, (D) meningothelial meningioma WHO G1 with prominent inflammatory cell infiltrate, (E) fibrous meningioma WHO G1, (F) hemangiopericytoma with prominent hyalinization WHO G2, (G) metastatic adenocarcinoma (lung), and (H) glioblastoma with typical morphology: palisading necrosis and pathological blood vessels with microthrombi and anaplasia WHO G4. Arrows: black — multiple neoplastic cells infiltrating the adjacent white matter of CNS, red — infiltration of inflammatory cells, blue — metastatic adenocarcinoma cells, brown — palisading necrosis, green — proliferation of pathological blood vessels. Results of one representative analysis shown. Bar 500 µm.

