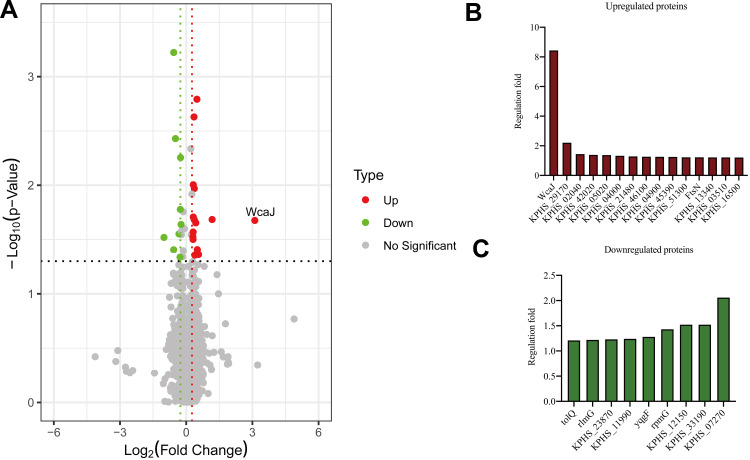
Figure 3.
Proteome analysis and capsule staining. (A) Volcano plot showing the comparison of quantitative protein expression between ampR+ (AH1689-2, AH3176-1 and AH3178-1) and ampR− (AH1689-3, AH1689-4, and AH1689-5) Klebsiella pneumoniae isolates. (B, C) Differentially expressed proteins with a fold change over 1.2 are marked in colour.

