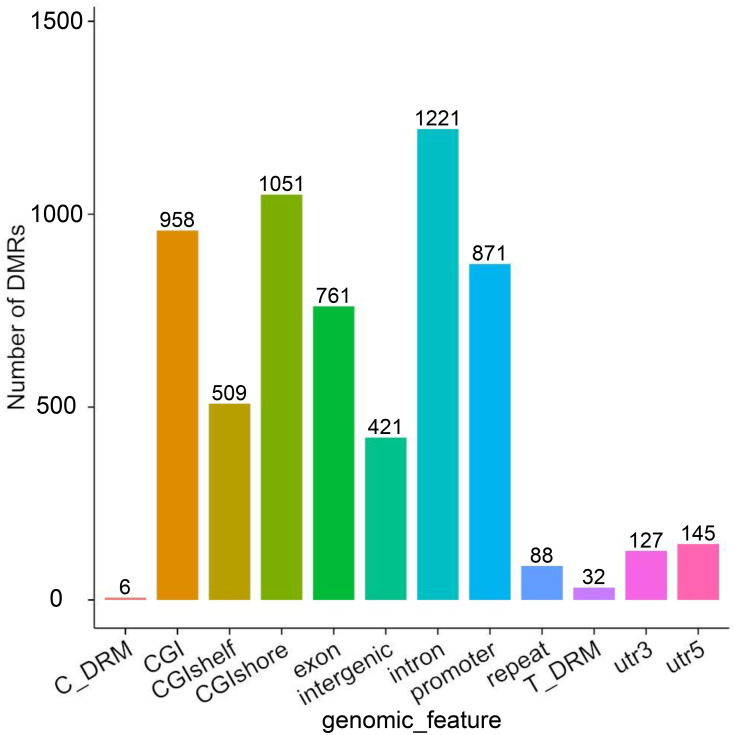
Figure 1.
The distribution DMRs in the various genomic elements. The horizontal coordinate represents different functional areas, and the vertical coordinate represents the proportion of DMR in different functional areas.
Abbreviations: Utr, untranslated region; CpG island, 200 bp (or more) stretch of DNA with a C+G content of 50% and an observed CpG/expected CpG greater than 0.6; CGI shore, the flanking region of CpG islands, 0–2000 bp; CGI shelf, regions flanking island shores, covering 2000–4000 bp distant from the CpG island; Y, Number of DMRs.

