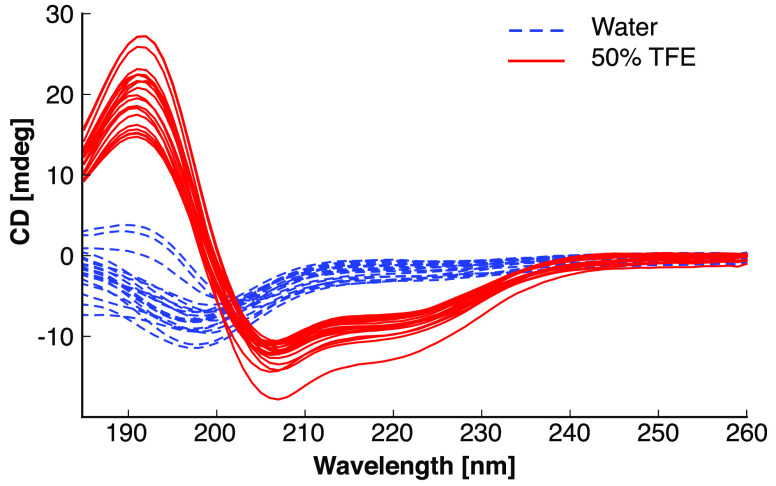
Figure 2.
Circular dichroism spectra of all peptides. All measurements were performed under equal conditions with a peptide concentration of 33 μM. The maximum at 190 nm and the minima at 208 and 222 nm are characteristic of α-helical secondary structures. Every line represents the average of three technical replicates under the indicated condition (blue, water; red, 50% TFE in water).

