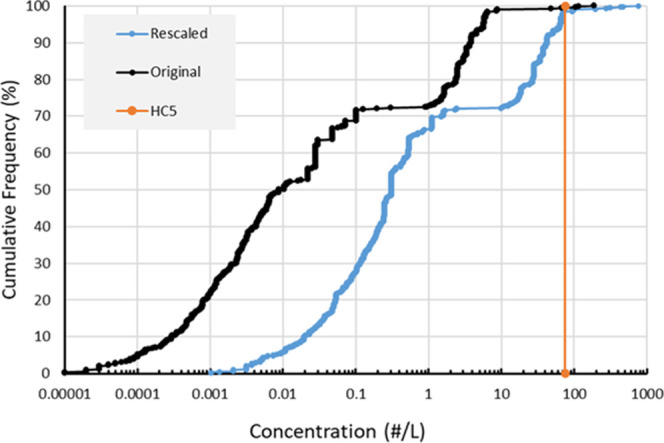
Figure 2.

Cumulative frequency distribution of original global microplastic concentrations in surface freshwater taken from (15) (black curve), the same data consistently rescaled to 1–5000 μm, (blue curve), compared to the concentration (ECX,env; eq 8) protecting 95% of species obtained from threshold effect concentrations corrected for bioavailability and polydispersity as defined by probability density distributions for environmental microplastic (HC5, vertical orange line, obtained from the SSD in Figure 3B).
