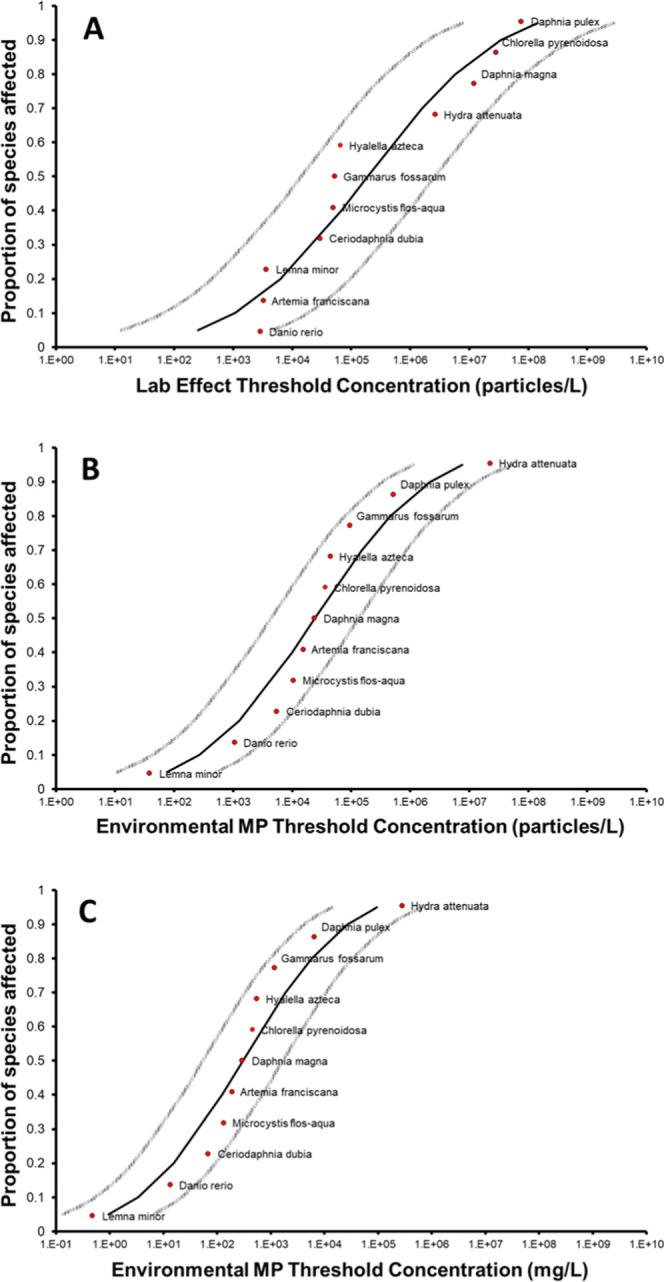
Figure 3.

Species sensitivity distributions for microplastic based on laboratory data for different types of particles (panel A, R2 = 0.896, HC5 = 251 #/L), and based on the same data after corrections for bioavailability and polydispersity at the threshold effect concentration resulting in (ECX,env) x-axis values in particles/L (panel B, R2 = 0.940, HC5 = 75.6 #/L) or mg/L (panel C, R2 = 0.940, HC5 = 0.94 mg/L). Gray curves relate to 95% confidence intervals.
