Figure 1.

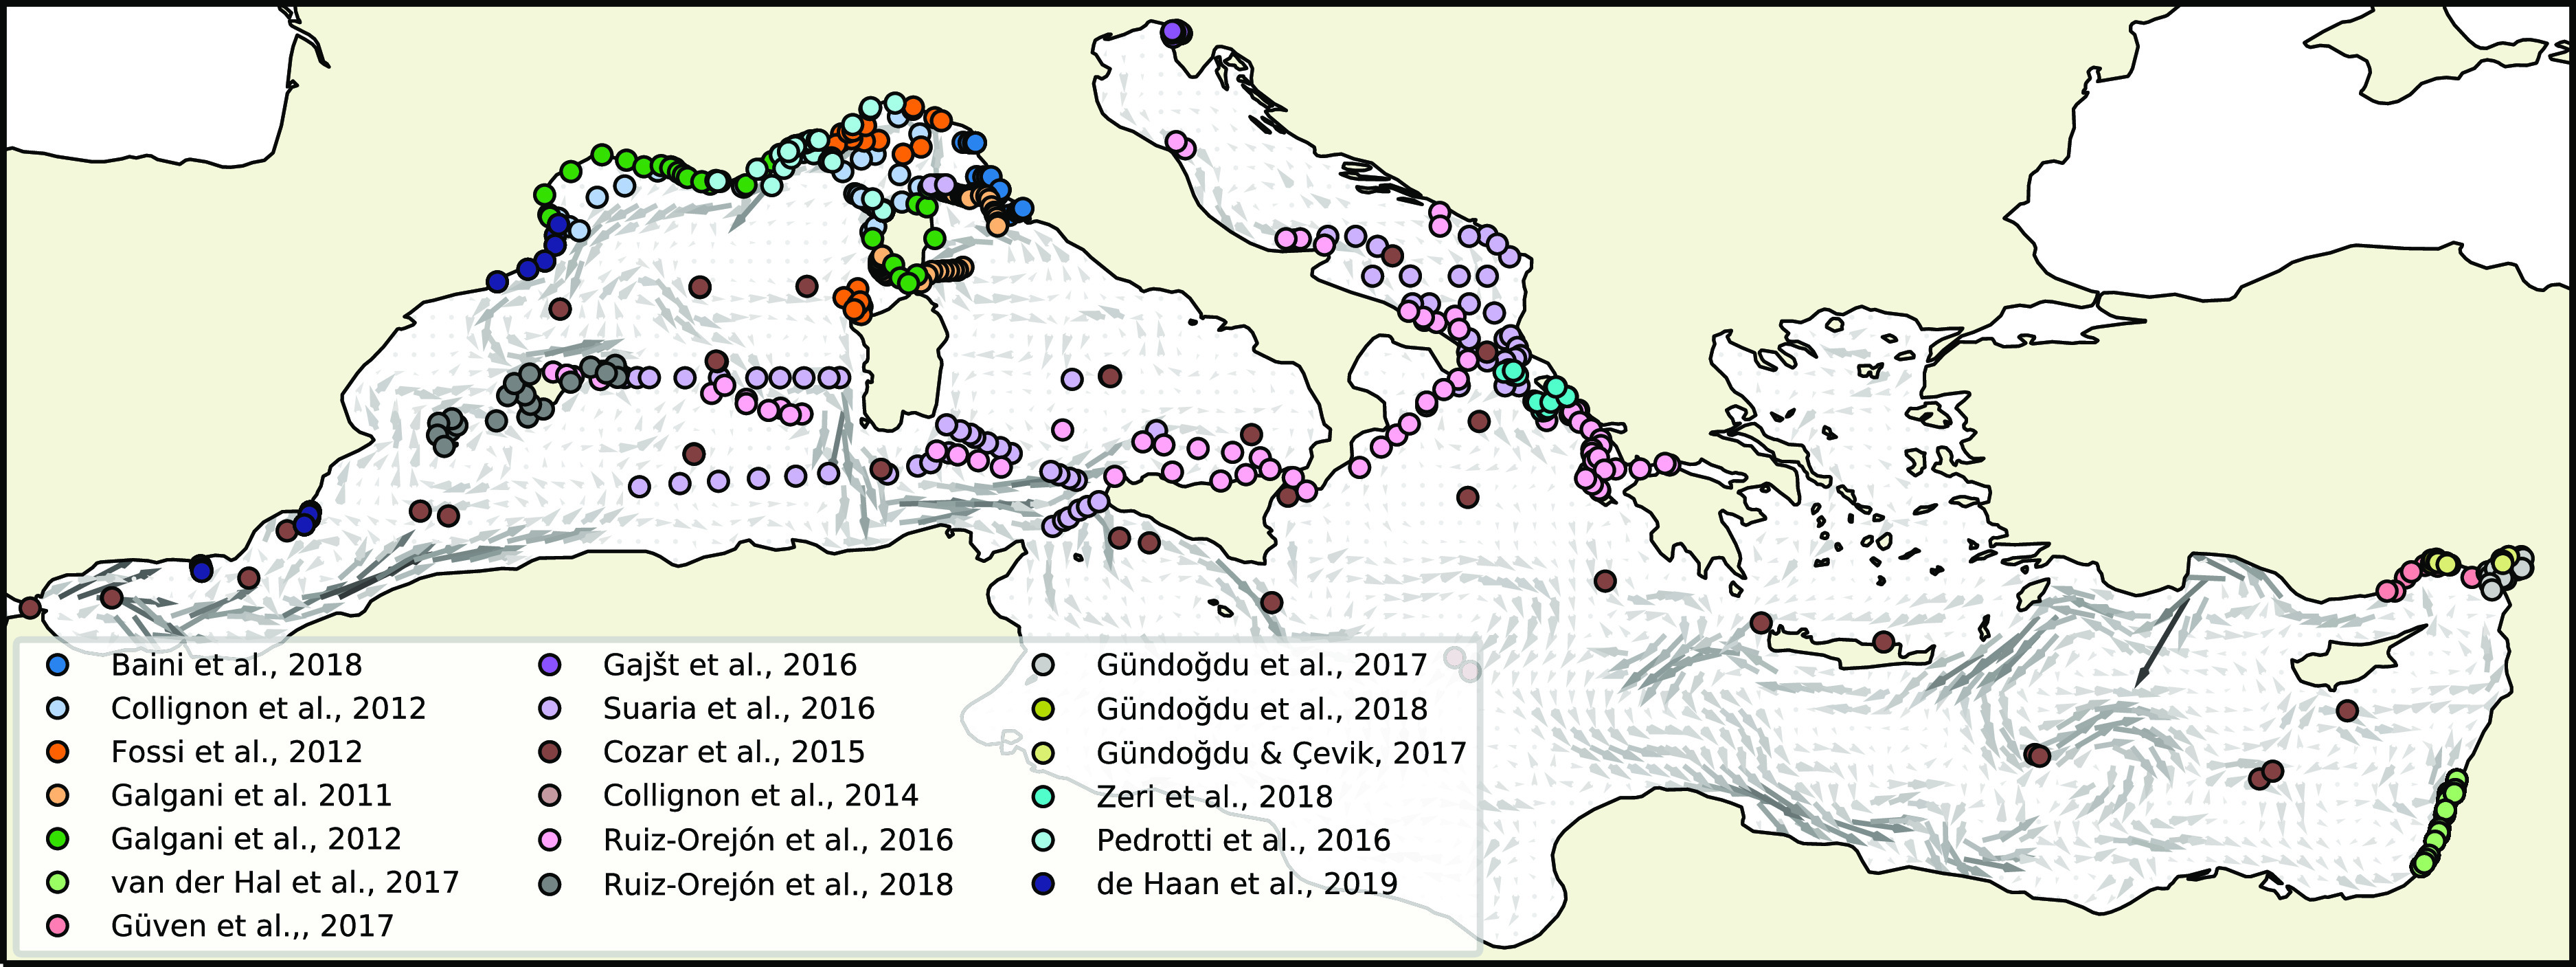
Available plastic measurements used here (colored dots) and the time-mean surface currents over 2006–2016 (grey arrows).

Available plastic measurements used here (colored dots) and the time-mean surface currents over 2006–2016 (grey arrows).