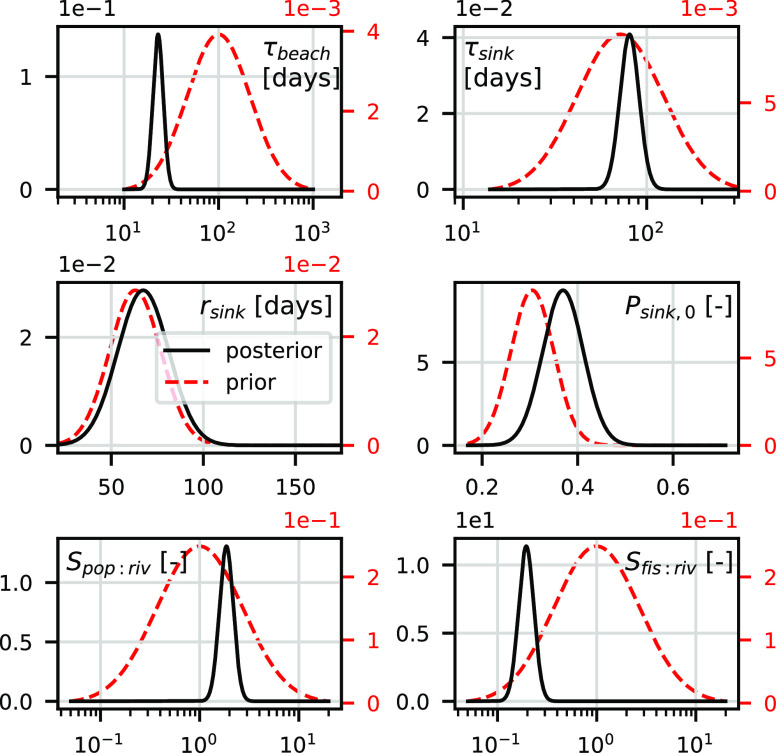
Figure 3.
Prior (red dashed lines, right y-axes) and posterior (black solid lines, left y-axes) probability density functions for the estimated parameters defining sources and sinks of floating plastic particles. For probability density functions plotted using a logarithmic x-axis, parameters were defined in terms of the log10 of the values.

