
FIGURE 4.
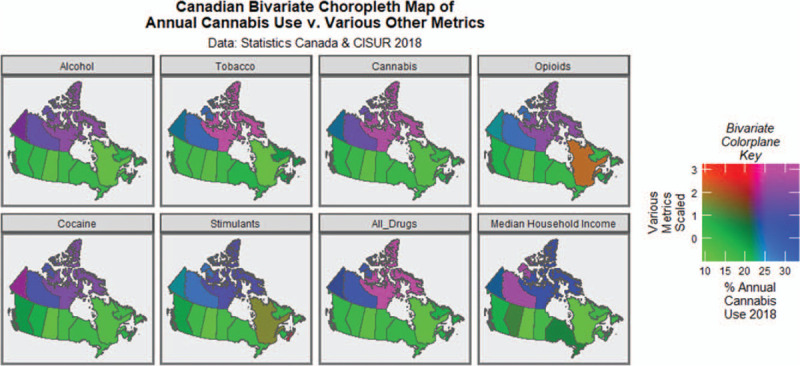
Bivariate choropleth map of cannabis use rate against the use of various other addictive drugs and median household income.
Official websites use .gov
A
.gov website belongs to an official
government organization in the United States.
Secure .gov websites use HTTPS
A lock (
) or https:// means you've safely
connected to the .gov website. Share sensitive
information only on official, secure websites.
Bivariate choropleth map of cannabis use rate against the use of various other addictive drugs and median household income.