
. 2020 Mar 13;14(5):e195–e210. doi: 10.1097/ADM.0000000000000638
Copyright © 2020 The Author(s). Published by Wolters Kluwer Health, Inc. on behalf of the American Society of Addiction Medicine.
This is an open access article distributed under the terms of the Creative Commons Attribution-Non Commercial-No Derivatives License 4.0 (CCBY-NC-ND), where it is permissible to download and share the work provided it is properly cited. The work cannot be changed in any way or used commercially without permission from the journal. http://creativecommons.org/licenses/by-nc-nd/4.0
FIGURE 5.
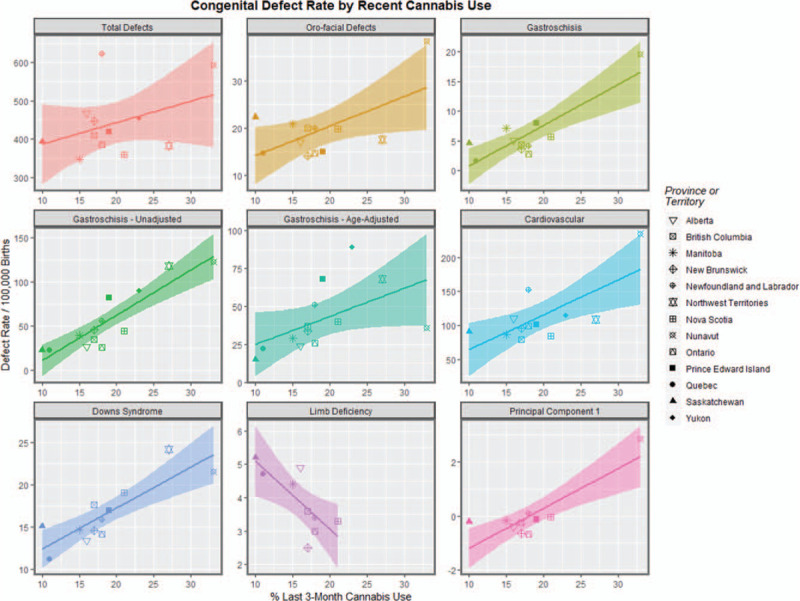
Scatterplot of the rate of various defects by cannabis use rates including regression lines.