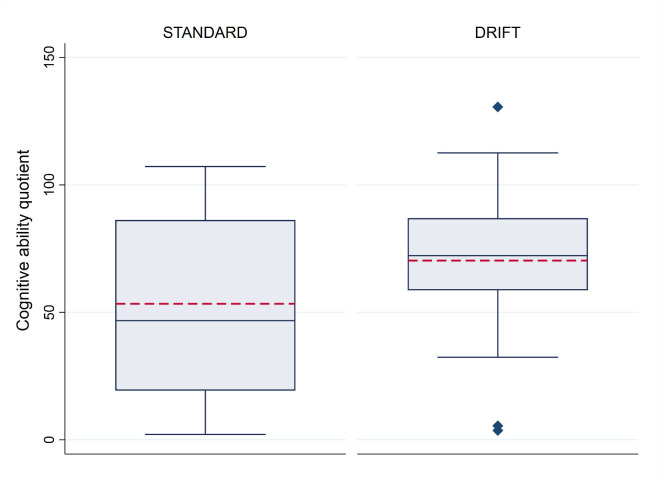
Figure 2.
Cognitive quotient, by trial allocation. The box plot indicates the median (central blue line in the box), mean (red dashed line), 25th percentile (bottom line of the box), 75th percentile (top line of the box), and the whiskers for the minimum and maximum values (excluding outliers). The diamonds beyond these whiskers are the outliers, which are observations that lie at an abnormal distance from other values. Outliers are defined as those higher than 1.5× IQR+75th percentile or lower than 25th percentile−1.5× IQR. DRIFT, drainage, irrigation and fibrinolytic therapy.

