
Figure 2.
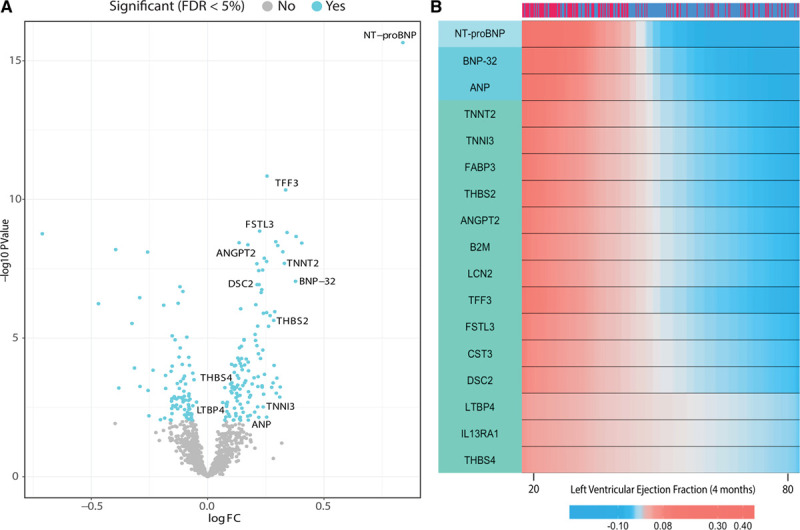
Plasma proteins associated with post–myocardial infarction heart failure and 4-month post–myocardial infarction left ventricular ejection fraction.
A, Volcano plot of the 1128 proteins measured in CDCS and their protein differential expression estimates by Limma. Colored dots represent significantly associated proteins at FDR ≤ 5%. B, Heat map of the protein expression levels vs left ventricular ejection fraction at 4 months (x axis). The strength of the correlation between protein expression and LVEF is indicated by the red and blue gradients of the heat map; a deeper shade of red indicates that higher protein levels (overexpression) correlate more strongly with a particular LVEF value, whereas a deeper shade of blue indicates that lower protein levels (underexpression) correlate more strongly with a particular LVEF value. The 17 proteins all show a negative correlation with LVEF such that high protein levels (deeper red) is observed with lower LVEF values. Patient group is indicated as HF in dark red and control in dark blue (top bar). A subset of the 96 significant proteins with the most highly correlated coefficients are shown (FDR ≤ 5%). The left bar shows the unsupervised hierarchical protein clusters. Protein expression levels have been smoothed by a nonparametric regression model. CDCS indicates Coronary Artery Disease Cohort Study; FC, fold change; FDR, false discovery rate; HF, heart failure; LVEF, left ventricular ejection fraction; and NT-proBNP, N-terminal pro B-type natriuretic peptide.