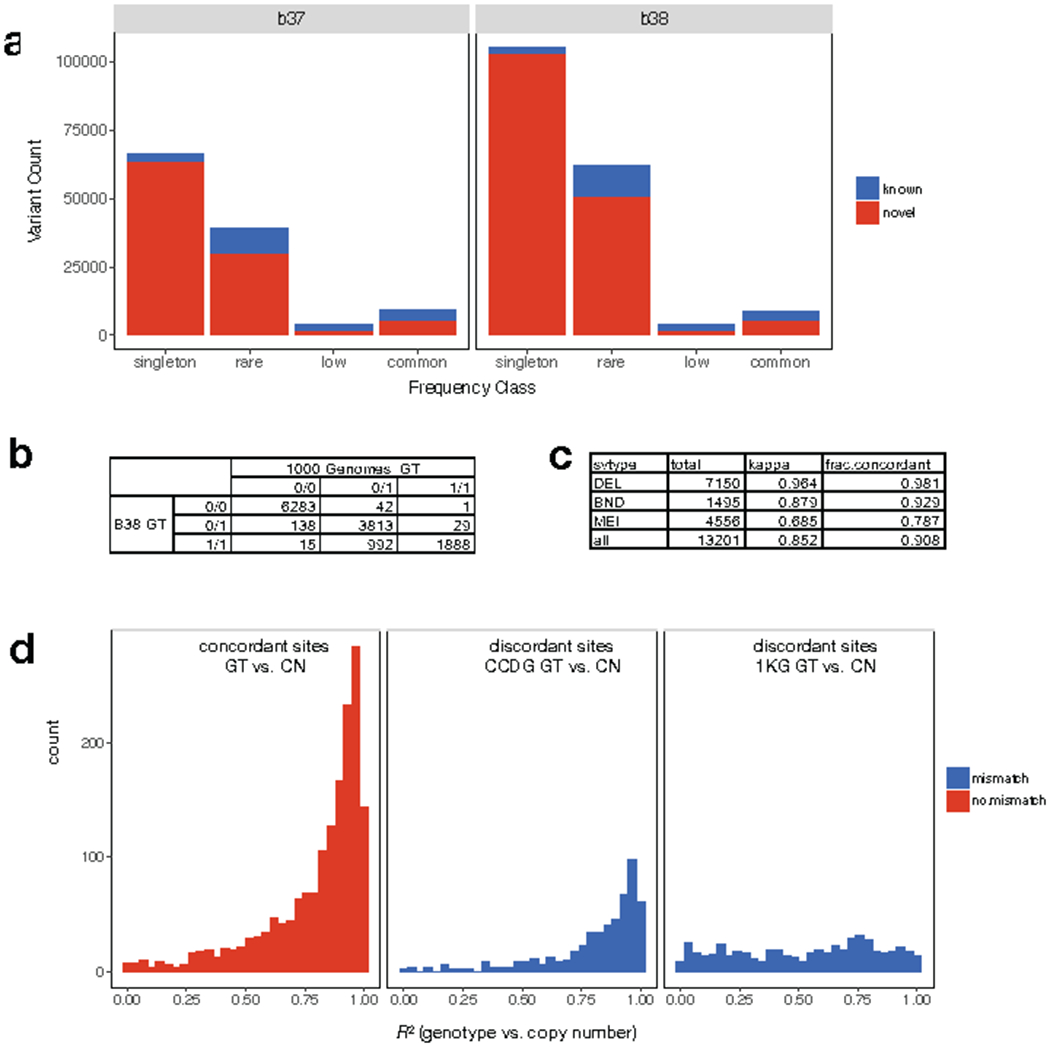
Extended Data Figure 7.

Comparison of SV calls and genotypes to the 1000 Genomes (1KG) Phase3 callset4. (a) number of known and novel SVs in the B37 (left) and B38 (right) callsets, shown by frequency class. (b) Table showing the genotypes reported in our B38 (rows) callset versus 1KG (columns) at SVs identified by both studies among the five samples included in both callsets. (c) Table showing genotype concordance by SV type including the fraction of concordant calls and Cohen’s Kappa coefficient. (d) Distribution of correlation (R2) between genotype (GT) information determined by breakpoint-spanning reads and copy number (CN) estimates determined by read-depth analysis for the SVs shown in parts (b) and (c), when genotype information between the B38 and 1KG callset are concordant (left) or discordant (middle, right). At sites with discordant genotypes, correlation with copy number information is typically higher for genotypes from the B38 callset (middle) than the 1KG callset (right).
