
Extended Data Figure 2.
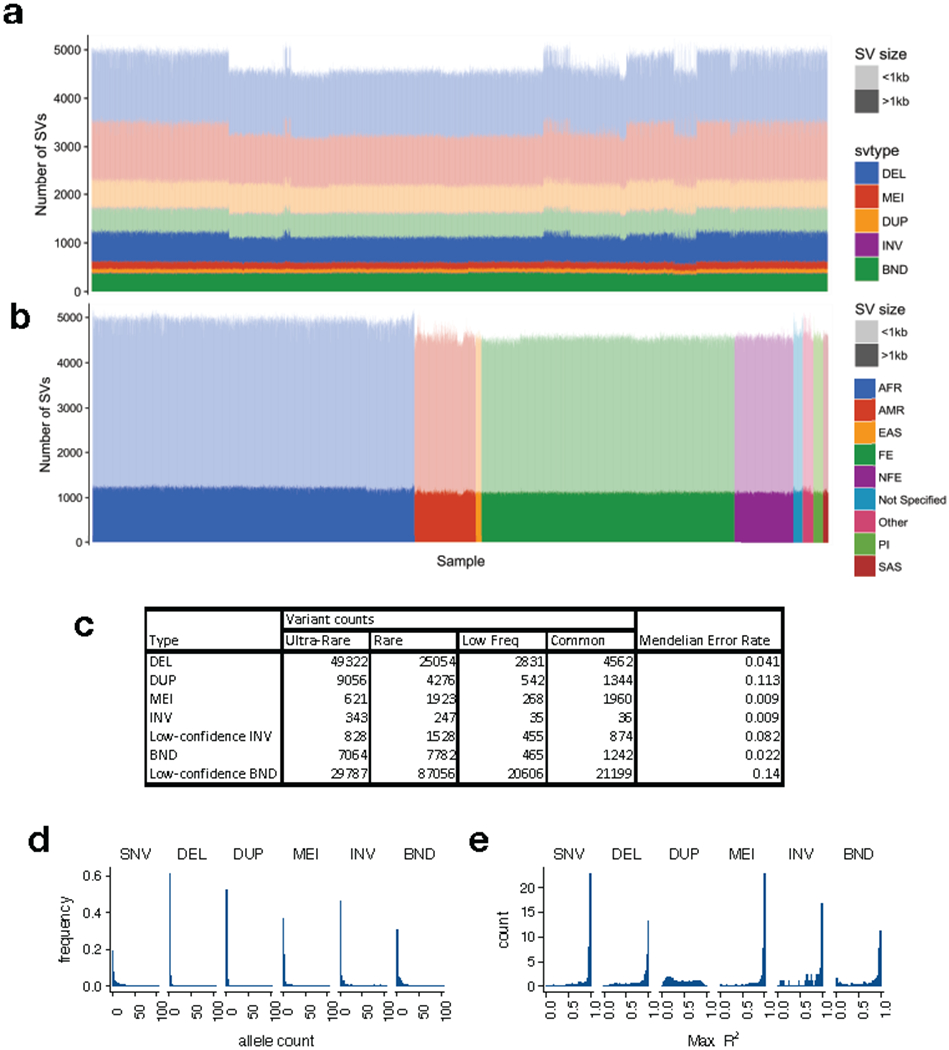
The B37 callset. (a) Variant counts (y-axis) for each sample (x-axis) in the callset, ordered by cohort, where large (>1 kb) variants are shown in dark shades and smaller variants in light shades. (b) Variant counts per sample, where samples are ordered by self-reported ancestry according to the color scheme at right, using the abbreviations described in Supplementary Table 1. Note that African-ancestry samples show more variant calls, as expected. (c) Table showing the number of variant calls by variant and frequency class, and Mendelian error rate by variant type. (d) Histogram of allele count for each variant class, showing alleles with counts ≤100. (e) Linkage disequilibrium of each variant class as represented by max R2 value to nearby SNVs, for N=1581 samples. Note that these distributions mirror those from our prior SV callset for GTEx3, which was characterized extensively in the context of eQTLs.