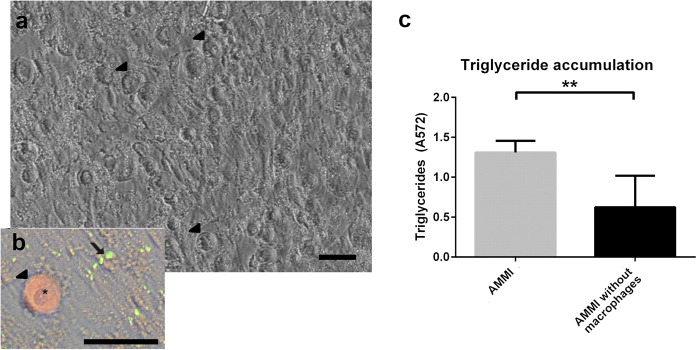
Fig. 3.
Adipocyte–Macrophage model with IFNγ (AMMI). Image a Phase contrast image of adipocytes and macrophages. Image b Close-up of macrophage in the culture: phase contrast image combined with AdipoRed (green) stained adipocytes and macrophage stained with CD11b (red). Macrophages marked with arrow heads and lipids stained with adipored marked with arrow. Macrophage nucleus can be seen in the close-up (asterisk). Obtained with Nikon Eclipse TS100 inverted fluorescence microscope and digital sight DS-U2 –camera. Scale bar 50 µm. c Triglyceride accumulation significantly differs between cultures with and without macrophages. Results depicted as mean ± SD, **p < 0.01

