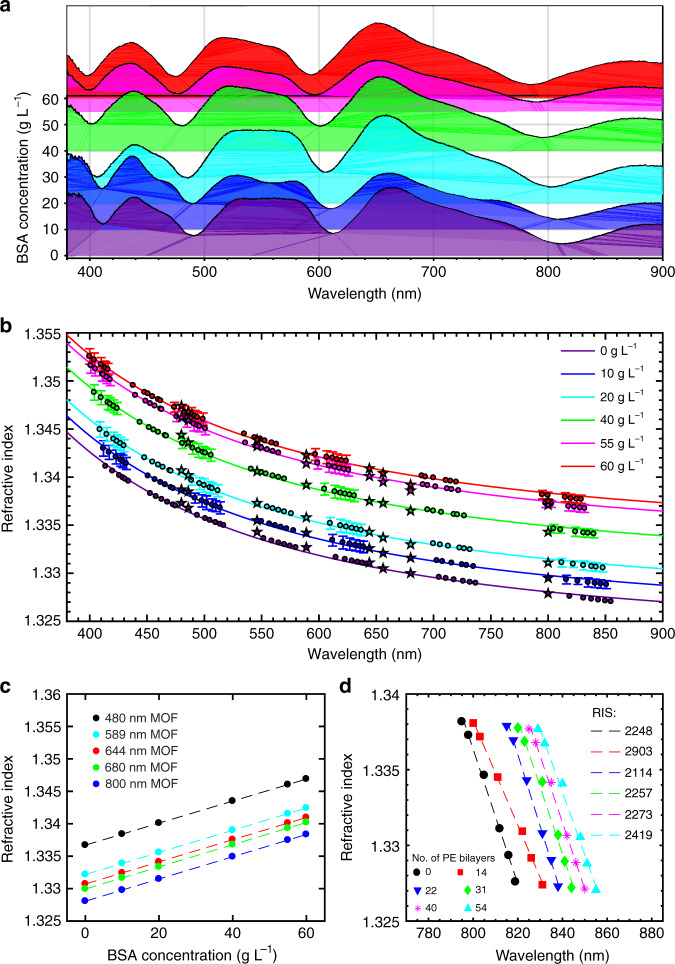
Fig. 5. Performance of IMOS for BSA dissolved in deionized water in static mode.
a Transmission spectrum evolution with increasing BSA concentration for the non-modified HC-MOF. b Optical dispersion of BSA in a water buffer with different concentrations. The coloured points indicate the RI values extracted from the shifts in the minima and the peak centroids of the fibre transmission spectra, and the solid lines mark their Sellmeier fits. For pure water, the Sellmeier fit describes the water dispersion adopted from ref. 38. The error bars are obtained from the spectrometer optical resolution. The stars mark RIs measured by the Abbe refractometer, provided for comparison. c Calibration relating the concentration of BSA and RIs of the BSA-water solution at different wavelengths. The RIs of BSA are extracted from the Sellmeier fits of the experimental points (see Table 1S). d The positions of the longest-wavelength minima as functions of RI extracted from (a) and (b). The error bars are smaller than the data points

