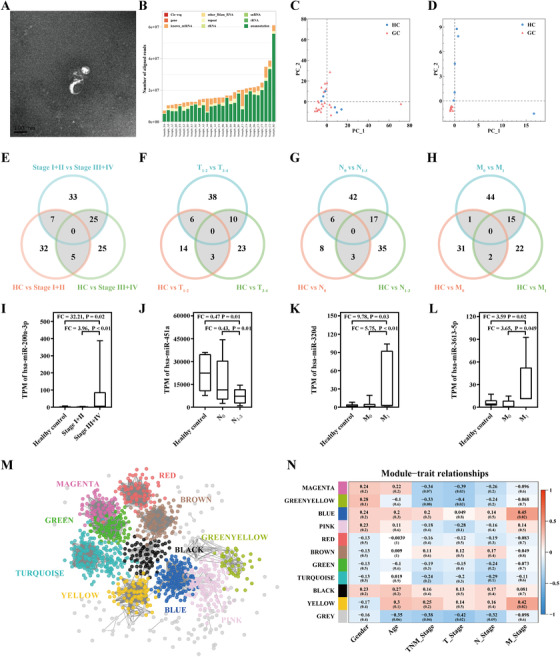
FIGURE 1.

A, Transmission electron microscopy of exosomes. B, Annotation results of exosomal small RNAs. C, PCA including all identified 1853 PEMs. Samples from both the HC group and the GC group were dispersed and partly overlapped. D, PCA including 31 dPEMs in GC patients compared with healthy controls. Samples from the GC group concentrated and separated from the HC group. E‐H, Identification of dPEMs related to different clinical pathological features. Based on different clinical pathological features, pairwise comparison among different subgroups (TNM pathological staging: Stage I+II/Stage III+IV subgroups, primary tumor invasion depth: T1‐2/T3‐4 subgroups, lymph node metastasis: N0/N1‐3 subgroups, and distant metastasis: M0/M1 subgroups). Venn diagrams were performed to find dPEMs in the intersection area. I‐L, Transcripts per million (TPM) of four dysregulated PEMs related to clinical pathological features. M, Ten PEM co‐expressed modules were identified in the whole weighted network. Different modules are distinguished by different colors. Grey nodes do not belong to any module. N, Matrix of correlations among modules and clinical pathological features
