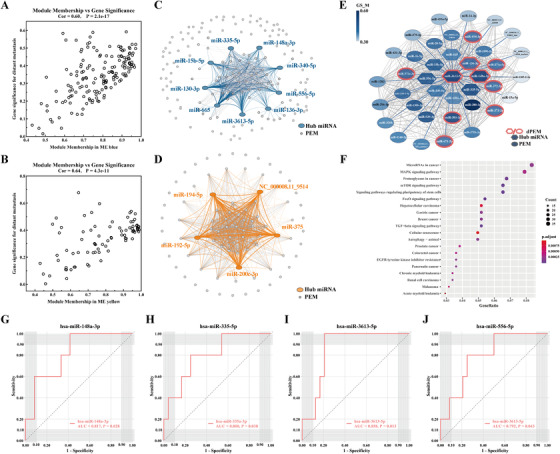
FIGURE 2.

A,B, Correlation between MM and GS in BLUE and YELLOW. C,D, Co‐expression network in BLUE and YELLOW. E, The core contained hsa‐miR‐3613‐5p and its co‐expressed PEMs in BLUE. Each node in the figure represent a PEM. The node color was related to the GS associated with distant metastasis. F, Top 20 enriched KEGG pathway of target genes of exosomal hsa‐miR‐3613‐5p and its co‐expressed PEMs. G,J, ROC of hub miRNAs in BLUE module. ROC–AUC of hsa‐miR‐148a‐3p was 0.817 (0.638‐0.996, P‐value = .028). The optimal sensitivity and specificity of hsa‐miR‐148a‐3p was 100% and 58.3%, respectively, with a cut‐off value of 453.526. ROC–AUC of hsa‐miR‐335‐5p was 0.800 (0.601‐0.999, P‐value = .038). The optimal sensitivity and specificity of hsa‐miR‐335‐5p was 80.0% and 75.0%, respectively, with a cut‐off value of 159.144. ROC–AUC of miR‐3613‐5p was 0.858 (0.721‐0.995, P‐value = .013). The optimal sensitivity and specificity of miR‐3613‐5 was 100.0% and 79.2%, respectively, with a cut‐off value of 9.272. ROC–AUC of hsa‐miR‐556‐5p was 0.792 (0.602‐0.981, P‐value = .043). The optimal sensitivity and specificity of hsa‐miR‐556‐5p were 80.0% and 75.0%, respectively, with a cut‐off value of 5.256
