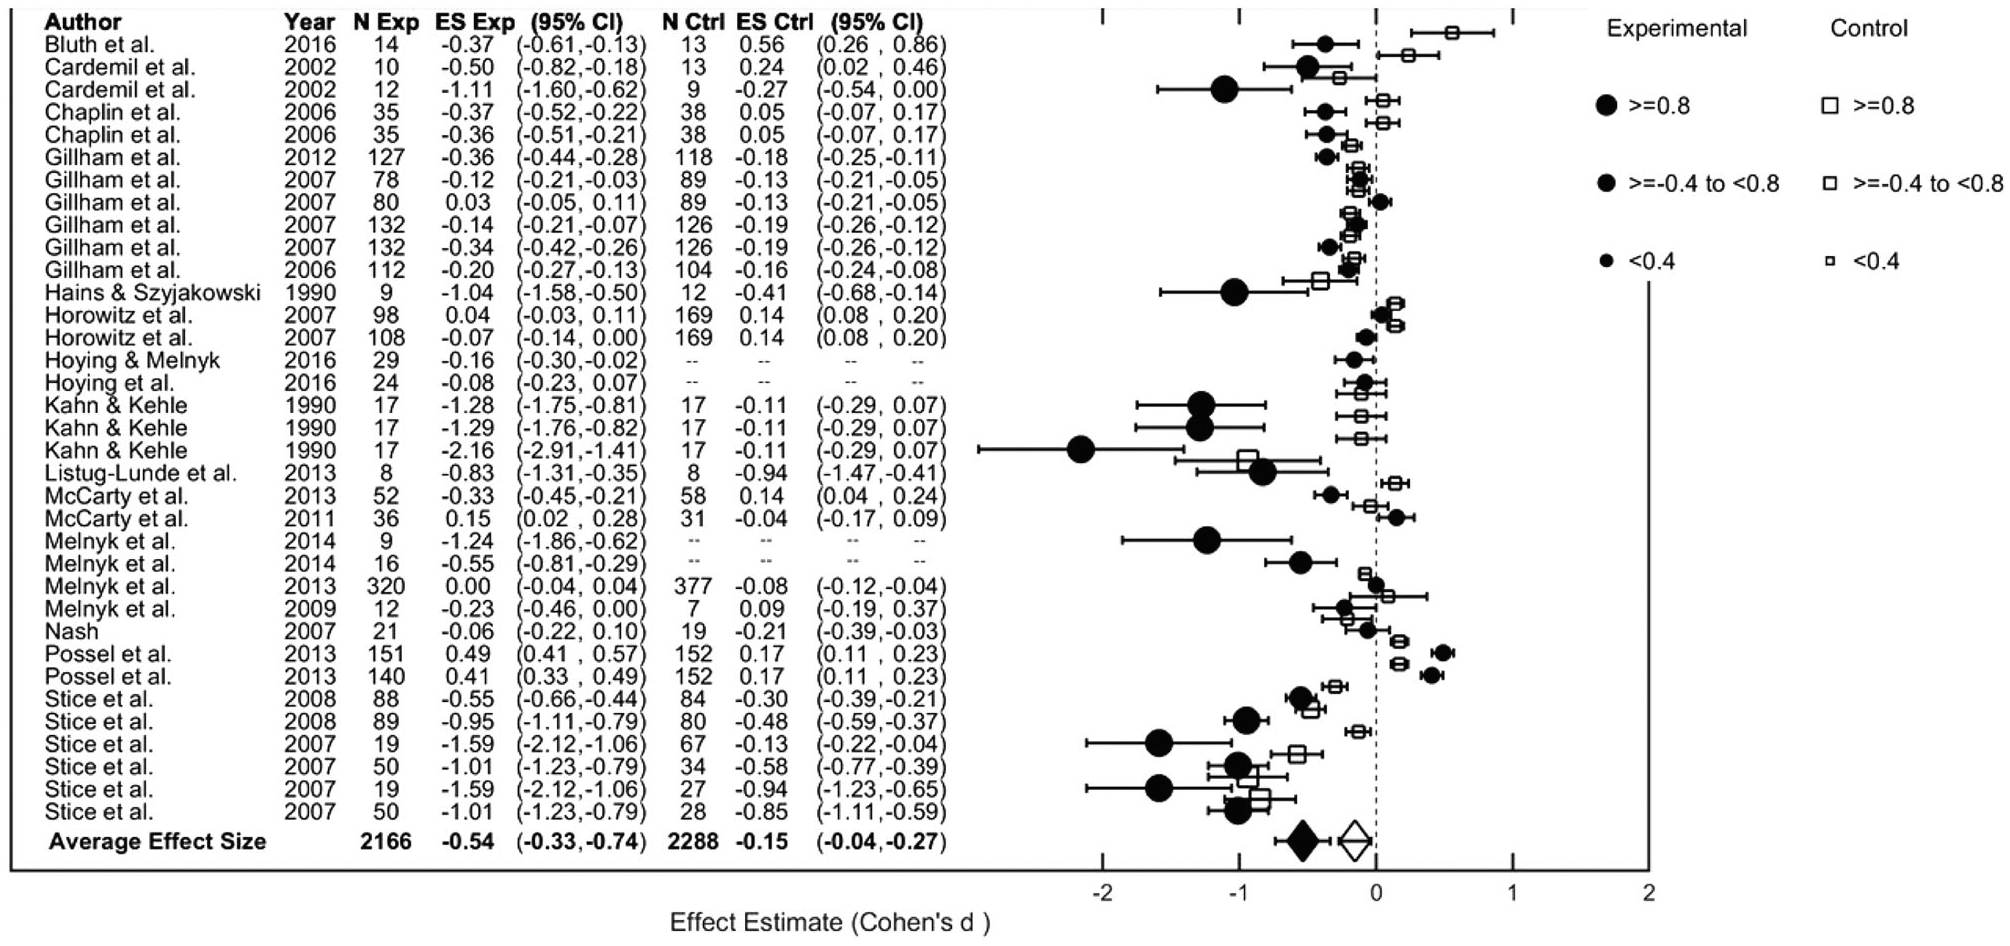
Fig. 6.

Forrest plot of effect sizes for comparisons between intervention and control groups on changes in depressive symptoms using the BDI, BDI-II, BYI-II, CDI, CDI-S, MFQ, or SMFQ immediately post-intervention

Forrest plot of effect sizes for comparisons between intervention and control groups on changes in depressive symptoms using the BDI, BDI-II, BYI-II, CDI, CDI-S, MFQ, or SMFQ immediately post-intervention