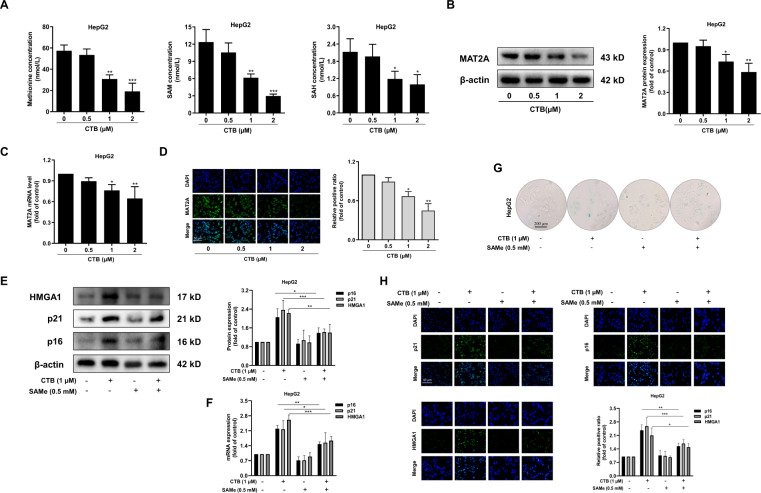
Fig. 2. CTB-induced HCC cells senescence by inhibiting methionine cycle metabolism.
HepG2 cells were incubated with the prescribed concentration of CTB or SAMe for 24 h. A Measurements of methionine circulating metabolites via HPLC; B The protein expression of MAT2A was detected by western blot; C Real-time PCR was used to quantify the mRNA level of MAT2A; D Immunofluorescence analysis of MAT2A. Scale bars are 50 μm; E, F Western blot and real-time PCR were used to quantify the protein and mRNA levels of senescent markers p16, p21, and HMGA1. Graphic imprinting results were derived from three separate experiments; G β-galactosidase staining kits were used to determine the relative content of senescent cells. Scale bars are 200 μm; H Immunofluorescence in situ analysis of the expression of p16, p21, and HMGA1. The nucleus was stained by DAPI. Scale bars are 50 μm. Statistical significance for this graph, data are represented as mean ± S.D. (n = 3); *P < 0.05 vs. control, **P < 0.01 vs. control, and ***P < 0.001 vs. control.

